QR Code Statistics Report 2026: What 13 Million Real Scans Actually Show
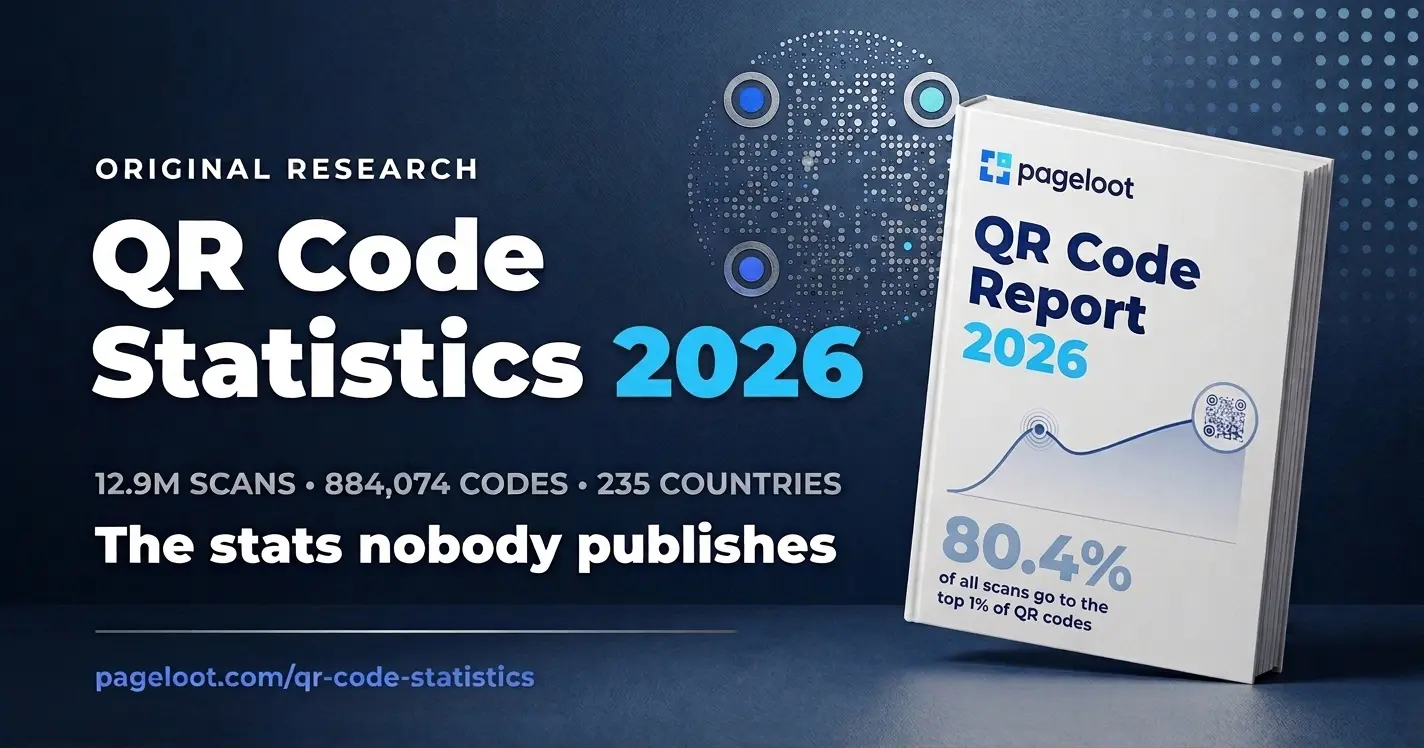
Most QR code statistics pages recycle the same Statista projections and survey claims. This report is different: we analyzed 12,988,255 scans across 884,074 QR codes created by 20,000+ brands in 110 countries — and published the numbers the industry doesn't. How many QR codes are never scanned. How unequal scan volume really is. How long a QR code actually lives. And how big the gap is between what marketers say and what they do.
In this report
- Key findings — 12 stats you can cite
- Methodology & dataset
- The QR code power law: top 1% take 80% of scans
- 34.6% of QR codes are never scanned
- QR code lifespan: most value arrives after day 90
- The edit gap: what marketers say vs. what they do
- 1 in 10 "scans" isn't human
- When people scan: day & hour heatmap
- Where people scan: 235 countries
- Devices: iPhone vs. Android
- What people turn into QR codes
- Market context: third-party numbers
- How to cite & reuse this data
- FAQ
Key findings
Every number below comes from Pageloot platform data: 12,988,255 scan events across 884,074 QR codes, July 2020 – July 2026. Full definitions in the methodology. You're free to cite any of these with attribution — see how to cite.
- The top 1% of QR codes capture 80.4% of all scans. The bottom 80% of codes capture just 4% between them.
- The median QR code gets exactly 1 scan. The mean is 26.3 — a 26x gap that makes "average scans per code" a misleading benchmark for any campaign.
- 34.6% of all QR codes are never scanned once. More than 1 in 3 codes ever created died with zero scans.
- Paying businesses do far better — but 1 in 7 of their codes still dies. Never-scanned rate: 14.6% on paid accounts vs. 35.8% on free trial accounts.
- QR codes on paid business accounts average 307 scans — 35x the trial-account average of 8.9. The medians: 9 scans vs. 1.
- 63.4% of a QR code's lifetime scans arrive after day 90. 40.5% arrive after year one (2023 cohort, 2.5+ years of observation).
- More than half of all the scans a QR code will ever get happen 6+ months after it was created. A QR code is a long-term asset, not a campaign.
- Even on paid accounts with full edit access, 67.5% of dynamic QR codes are never edited after the day they're created — and 54.8% are never edited at all. In marketer surveys, roughly 7 in 10 claim to update their codes at least monthly.
- 10.2% of raw QR "scan" traffic over the past 12 months came from bots — uptime monitors, link checkers, and crawlers, not humans.
- iOS accounts for 48.9% of human scans, Android 38.2%. 87.1% of all scans happen on mobile; Mobile Safari alone is 38.8% of scan traffic.
- The US is the #1 scanning country — with only 11.9% of global volume. Turkey, Ukraine, Indonesia, and Spain round out the top 5. Fastest-growing: Czechia (+101% YoY) and Ireland (+72%).
- Link QR codes are losing share: 44.8% of all codes ever created, but only 35.8% of 2025 creations. PDF codes nearly doubled to 24.3% of new codes, location codes grew 5x, and audio codes went from near-zero to 4%. 94.4% of all codes are dynamic.
Methodology & dataset
This report is based on aggregated, anonymized platform data from Pageloot, a QR code platform used by 20,000+ brands across 110 countries since 2019.
| Dataset | Value |
|---|---|
| Scan events analyzed | 12,988,255 |
| QR codes created (all-time) | 884,074 |
| Active codes in distribution analysis | 494,380 |
| Dynamic codes in edit-behavior analysis | 28,541 (paid accounts) |
| Observation window | July 2020 – July 2026 |
| Scan origins | 235 countries & territories |
Definitions. A "scan" is a server-side redirect event recorded when a dynamic QR code is scanned; static codes don't route through a server and can't be measured — an industry-wide limitation, not a Pageloot one. A "paid account" is any account with at least one successful charge, active or churned. The longevity cohort covers every code created in calendar year 2023, giving each at least 2.5 years of observed life. Percentiles and medians are computed across individual codes, not accounts.
Trial censoring. Codes on unconverted trial accounts are scannable and editable only during a trial window, so trial-account figures reflect both user behavior and trial expiry. Paid-account figures are uncensored — those codes stay active for as long as the account exists. For this reason, the edit-behavior analysis covers paid accounts only. The longevity cohort includes expired trial codes, which can only contribute early-life scans — meaning the lifespan figures, if anything, understate how back-loaded scan volume really is.
Bot handling. Device, OS, and browser figures exclude identified automated user agents (uptime monitors, crawlers, link checkers), which made up 10.2% of raw scan events in the last 12 months — a finding in its own right, covered below. Other totals are raw event counts, consistent with how every platform in the industry reports scans.
Limitations. This is single-platform data, and platform mix shapes the numbers: Pageloot skews toward small and mid-size businesses and marketing agencies. Timestamps are UTC. No personally identifiable information was used at any point — all queries were aggregate-only. Figures are refreshed quarterly; this page states its last-verified date at the bottom.
The QR code power law: the top 1% take 80% of scans
Industry reports love one number: average scans per QR code. Some cite 70+. Our platform-wide mean is 26.3. Both numbers are technically true and practically useless, because QR scan volume follows an extreme power-law distribution — and averages lie in power laws.
Here's the real shape of the data. We ranked all 494,380 active QR codes by total scans and computed each percentile's share of the 12.99M total:
Cumulative share of all scans, by top X% of QR codes
Hover the curve. Dashed line = perfectly equal distribution.
Source: Pageloot platform data, 494,380 QR codes, 12.99M scans, 2020–2026. Chart reusable under CC BY 4.0 with attribution.
| Segment | Codes | Share of all scans |
|---|---|---|
| Top 1% | 4,944 | 80.4% |
| Top 5% | 24,720 | 89.5% |
| Top 10% | 49,440 | 92.8% |
| Bottom 80% | 395,504 | 4.0% |
The percentile view makes the same point brutally: the median QR code has 1 scan. The 90th percentile has 12. You need to reach the 99th percentile before a code has 161 scans — and the mean of 26.3 sits above the 90th percentile, dragged there entirely by a small set of monster codes on restaurant tables, product packaging, and storefronts.
34.6% of QR codes are never scanned
Of the 494,380 active QR codes on the platform, 170,950 — 34.6% — have zero scans. Not "low engagement." Zero. More than one in three QR codes ever made was printed, posted, tested, or abandoned without a single human pointing a camera at it.
Two objections apply here: trial accounts create test codes, and on Pageloot unconverted trial codes also stop being scannable after the trial window (see methodology). Both inflate the trial-side number — so the split by whether the account has ever paid is the one that matters:
median: 1 scan · mean: 8.9
median: 9 scans · mean: 307
paid vs. free accounts
Two findings hide in that split. First, the trial excuse only goes so far: even among businesses that pay for QR codes, 1 in 7 codes never gets scanned. Money buys intent, not placement. Second, the 35x gap between paid and trial codes is the clearest signal in this entire dataset of what separates working QR codes from dead ones — codes attached to a real business use case (a menu, a product, a review flow, a payment) get scanned; codes created "to try it out" don't.
QR code lifespan: most of the value arrives after day 90
The biggest misconception in this category is that a QR code is a campaign asset — spike, decay, done. The data says the opposite. To measure lifespan cleanly, we took every code created in 2023 (each with 2.5+ years of observed life) and bucketed its scans by the code's age at the moment of each scan:
When do scans happen? Share of lifetime scans by code age (2023 cohort)
Every QR code created in 2023 · 2.46M scans · hover the bars
Source: Pageloot platform data, 2023 creation cohort. Chart reusable under CC BY 4.0 with attribution.
Read that again: only 21.7% of a QR code's lifetime scans happen in its first week. 63.4% arrive after day 90. 40.5% arrive after the code's first birthday — and the year 1–2 bucket (23.3%) is bigger than the launch week. The 50% mark of lifetime scans is crossed after month 6. QR codes don't behave like ad campaigns. They behave like assets that compound as printed material circulates: business cards sit in drawers, menus stay laminated, packaging sits on shelves, stickers stay on windows.
The edit gap: what marketers say vs. what they actually do
The headline feature of dynamic QR codes is editability: change the destination after printing. In survey data published by Bitly, roughly 7 in 10 marketers claim they update or redirect their dynamic codes at least monthly. Our platform data measures what actually happens — restricted to the 28,541 dynamic codes on paid accounts, where edit access is unrestricted for the code's entire life:
That's a massive say/do gap — and this is the flattering version of the number, measured only on paying customers who can edit any code, any time, at no extra cost. At the code level, two-thirds are never touched after launch day. The biggest cluster of first edits happens within 24 hours of creation — typo fixes and setup changes, not campaign management.
Does this mean editability is useless? No — it means it's mispriced in most buyers' heads. Editability isn't a workflow feature you use monthly. It's insurance against reprinting. About a third of paid codes eventually get a real post-launch edit — each one an avoided reprint of business cards, menus, or packaging when a URL dies, a PDF updates, or a campaign pivots. One avoided reprint typically pays for years of the feature. Just don't buy a QR platform because you imagine yourself A/B-testing destinations every week. The data says you won't.
1 in 10 "scans" isn't human
Over the last 12 months, 10.2% of raw scan events on our platform came from automated agents — uptime monitors, security link-checkers, and crawlers that follow QR redirect URLs. We identified them by user agent and excluded them from every device, OS, and browser figure in this report.
When people scan: day & hour heatmap
Friday is the busiest scanning day (15.6% of weekly scans), followed by Saturday (15.1%). Sunday is quietest (12.7%). The gap is real but modest — QR scanning is an everyday behavior, not a weekend one.
Scan volume by day of week and hour (UTC), last 12 months
Darker = more scans · hover any cell
Source: Pageloot platform data, last 12 months. Times in UTC — with a European-heavy scan base, peak local time skews roughly 1–3 hours later. Chart reusable under CC BY 4.0 with attribution.
The single busiest windows are Friday 08:00 UTC and Saturday midday — a workweek-lunch and weekend-leisure pattern consistent with menus, retail, and events driving volume. On calendar seasonality, our data contradicts a common industry claim that December is peak QR season: on this platform, May, October, and March are the strongest months, with December mid-table. Seasonality is a function of what your codes are printed on, not the calendar.
Where people scan: 235 countries & territories
Scans were recorded from 235 countries and territories; 125 of them logged 1,000+ scans. The headline: QR scanning is far less US-centric than US-focused reports suggest. The United States is the #1 country — with just 11.9% of global volume.
Top 15 countries by all-time scans
Hover the bars
Source: Pageloot platform data, 2020–2026. Chart reusable under CC BY 4.0 with attribution.
Fastest-growing scan markets (YoY, min. 5,000 scans)
| Country | Last 12 months | Prior 12 months | Growth |
|---|---|---|---|
| Czechia | 46,551 | 23,186 | +101% |
| Ireland | 43,533 | 25,351 | +72% |
| Iraq | 85,561 | 59,231 | +44% |
| Austria | 7,273 | 5,320 | +37% |
| Italy | 51,012 | 40,770 | +25% |
| Sweden | 44,099 | 35,536 | +24% |
Devices: iPhone edges out Android, Safari dominates
Across the last 12 months of human scans (bots excluded), 87.1% happened on a mobile device. iOS leads Android 48.9% to 38.2% globally on this platform — with the usual regional caveat that iOS dominates in North America and Western Europe while Android leads across Asia and much of the rest of the world.
Operating system share of human scans, last 12 months
Automated user agents excluded
Source: Pageloot platform data, last 12 months, bot traffic excluded. Chart reusable under CC BY 4.0 with attribution.
| Browser | Share of human scans |
|---|---|
| Mobile Safari | 38.8% |
| Chrome Mobile | 22.9% |
| Samsung Internet | 8.3% |
| Edge | 7.5% |
| Chrome Mobile (iOS) | 6.7% |
| Chrome (desktop) | 4.7% |
The practical takeaway: whatever a QR code points at will be judged on a phone, most often in Safari. If the landing page, PDF, or menu isn't mobile-first and fast, the scan was wasted — and per the power-law section above, most codes don't get many scans to waste.
What people turn into QR codes — and how it's shifting
The plain link QR code is still #1, but it's steadily losing share: 44.8% of all codes ever created, down to 35.8% of codes created in 2025. What's replacing it is content hosting — codes that carry the content themselves rather than pointing at a website:
QR code types: share of 2025 creations
Hover the bars for the shift vs. all-time share
Source: Pageloot platform data. Chart reusable under CC BY 4.0 with attribution.
Three shifts stand out. PDF codes nearly doubled — from 13.3% of historical creations to 24.3% of 2025 creations, driven almost entirely by multi-document codes that serve whole file sets (menus, manuals, catalogs, spec sheets) from one printed code. Location codes grew 5x in share (1.2% → 6.0%) as Google Maps QR codes became a review-generation and wayfinding staple. And audio QR codes appeared from nowhere to 4.0% — museums, memorials, product instructions, and voice notes. Meanwhile 94.4% of all codes on the platform are dynamic; static is now a niche for codes that will genuinely never change.
Market context: the third-party numbers, briefly
For completeness — since most people land on statistics pages looking for market-size figures — here are the widely-cited third-party numbers. Unlike everything above, these are not our data, and we'd encourage checking the primary sources:
| Stat | Figure | Source |
|---|---|---|
| Global QR code market, 2025 | ~$13.04B, projected ~$33.14B by 2030 | Mordor Intelligence |
| US smartphone users scanning QR codes, 2026 | ~102.6 million projected | eMarketer / Insider Intelligence |
| Dynamic QR codes' share of market | ~65% | Mordor Intelligence |
| Marketers using QR codes in campaigns | 90%+ | Multiple industry surveys |
Worth noting after the bot section: aggregate industry scan projections are built from platform-reported raw totals, which — per our data — include roughly 10% automated traffic that nobody was disclosing until now.
How to cite & reuse this data
Pageloot QR Code Statistics Report 2026 — pageloot.com/qr-code-statistics/
All statistics and charts on this page may be republished under CC BY 4.0: free to use in articles, research, presentations, and reports, with a link back to this page as attribution. The full aggregate dataset is public on GitHub: github.com/siimti/qr-code-statistics. Journalists: we can provide custom cuts (by country or code type) or a quote on any finding — usually same-day. Reach us via pageloot.com.
Data refresh: quarterly. Figures on this page were last verified July 2026.