QR Code analytics: track scans, locations and devices
QR Code analytics in Pageloot show you how many times a dynamic QR code was scanned, when, from which country and city, and on which device. You see which flyer, poster or package actually gets scanned. Start with a 14-day free trial, or see the plans.

Trusted by 20,000+ companies in 110 countries


How to track QR code scans in 3 steps
- 1. Make a dynamic QR code
Create a dynamic code in your Pageloot account. In the free generator, tick Track scans to start the 14-day free trial. A static code has no stats.
- 2. Print it and put it out
Use one code for each place, for example one for the flyer and one for the window sign. Scan it with your own phone first to check the link.
- 3. Open the stats
Open the code in your account to see its scans. Compare codes to find out which placement, country or device brings the most visitors, then move your budget there.
What QR code analytics show
Scan stats need a dynamic code. Make one and see your first scans today.

TOTAL SCANS
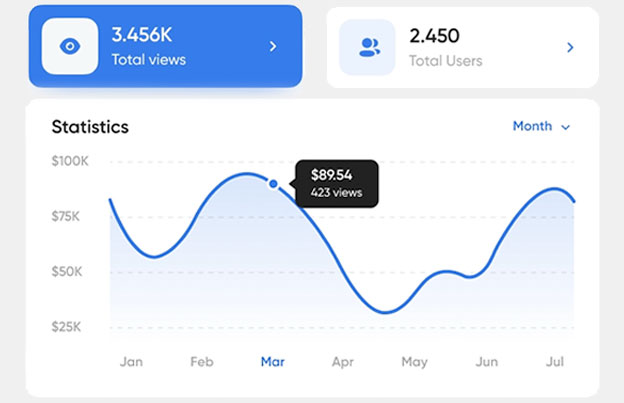
Track total scans over time
See how many times a code was scanned and on which days. Spot the days with the most scans and check whether a campaign or a new print run made a difference.
LOCATIONS
See where your scans happen
See the country and city of each scan. Use it to decide where to advertise, which language to use on the landing page and which store or event to focus on. Location comes from the scanner’s network, so treat it as an estimate.


DEVICES
Know which devices scan your code
See whether people scan with iOS or Android. Make sure the page behind your code works well on the phones your audience uses.
PLACEMENT
Compare which placements get scanned
Pageloot counts scans per code, so make a separate dynamic code for each flyer, package, business card or screen. Then compare the scan totals and keep the placements that work. You can also add UTM parameters to the destination link to follow the visits in Google Analytics.


See how "Brand Name" uses QR codes on their business cards
“Pageloot has completely transformed the way we network and share information. By integrating customizable QR codes on our business cards, we’ve made it incredibly easy for potential clients and partners to access our digital profiles, websites, and contact details.
I highly recommend it to any tech company looking to enhance networking and boost engagement.”
Enhances networking
Modern touch
Leaves a lasting impression
Ann Smith
Head of Marketing, Company
Frequently asked questions about QR Code analytics

For each dynamic code you can see the number of scans, when they happened, where (country and city) and which device was used. The level of detail depends on your plan, so check the plans page.
Yes. A static code holds the link itself and sends people straight to it, so nothing can be counted. A dynamic code points to a short link first, which lets Pageloot count each scan and lets you change the destination later.
No. Pageloot does not show names or personal identities. You see totals, times, places and device types.
Make a dynamic QR code in your Pageloot account, print it, then open the code in your account to see its scans. In the free generator, tick Track scans to start the 14-day free trial.
Location is an estimate based on the scanner’s network, usually at city level. It can be off when someone uses mobile data, a VPN or a company network.
Check that the code is dynamic and not static, that the code you printed is the one you are looking at in your account, and that your plan is still active. Also scan it yourself with a phone to confirm the link opens.
Only if it is a dynamic code. A printed static code cannot be tracked or changed. Make a new dynamic code and use it on your next print run.
Free codes are short links on pageloot.com. Adding a plus sign to the end of the short link shows a public total-scan count. For stats by day, country and device, use a dynamic code in your account.
Don’t miss out, get started today!
Start the 14-day free trial, or compare the plans on the pricing page.