
Are your QR code campaigns failing to drive the digital engagement you expected? When scan rates remain low, businesses often lose potential customers and waste budget on printed materials that the audience simply ignores. This guide explains how A/B testing allows you to optimize your strategy through data-driven adjustments to maximize scan volume and ROI.
Why A/B Testing is Essential for Marketing ROI
A/B testing, or split testing, involves comparing two versions of a QR code to determine which one resonates most with your audience. In physical marketing, this approach moves your strategy beyond guesswork by providing hard data on user behavior. Statistics show that tracking QR codes through A/B testing can lead to a 15-20% improvement in scan rates on average.
Relying on real-time data allows for agile campaign management. For instance, the retail giant Flipkart used analytics to tweak design elements mid-campaign, which ultimately boosted their scan-through rate by 15% and reached over two million scans. By identifying which variant performs better, you can scale the successful version and eliminate underperforming designs before committing to a full national rollout.
Variables to Test for Higher Engagement
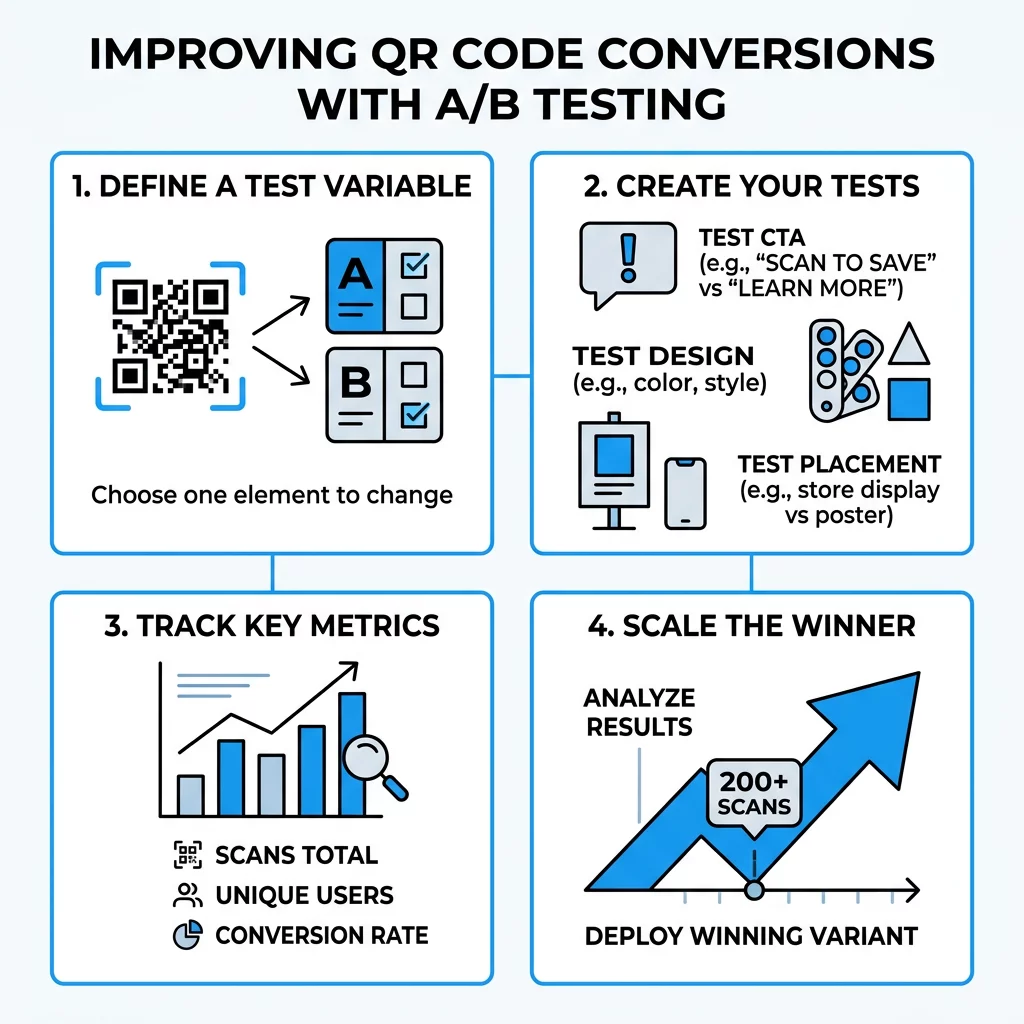
To achieve the most accurate results, you should isolate a single variable at a time. If you change the color, the placement, and the destination all at once, you will not know which specific change caused the performance lift.
Visual Design and Branding
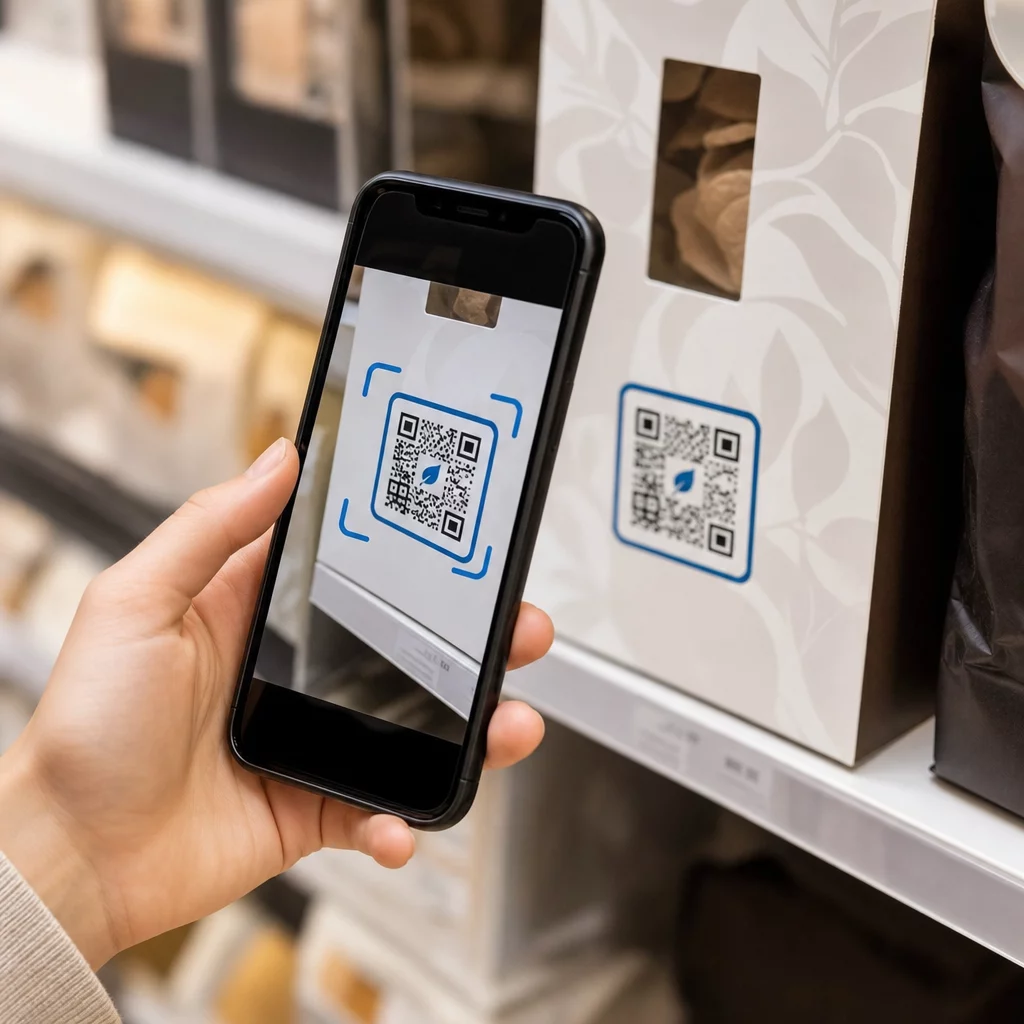
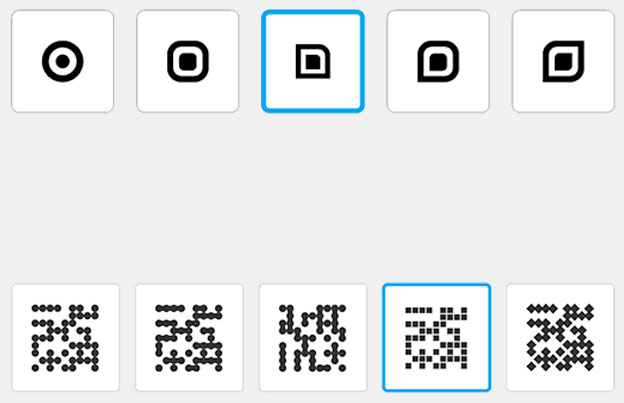
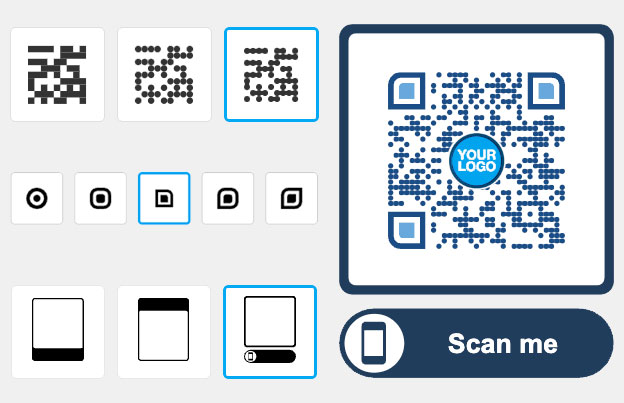
Comparing a standard black-and-white code against a customized design often yields dramatic results. Research indicates that branded QR codes can increase scan rates by up to 80% compared to generic, unbranded versions. Consider testing different brand colors, adding a centered logo, or using custom frames to see what builds the most trust with your users.
Call-to-Action (CTA) Messaging
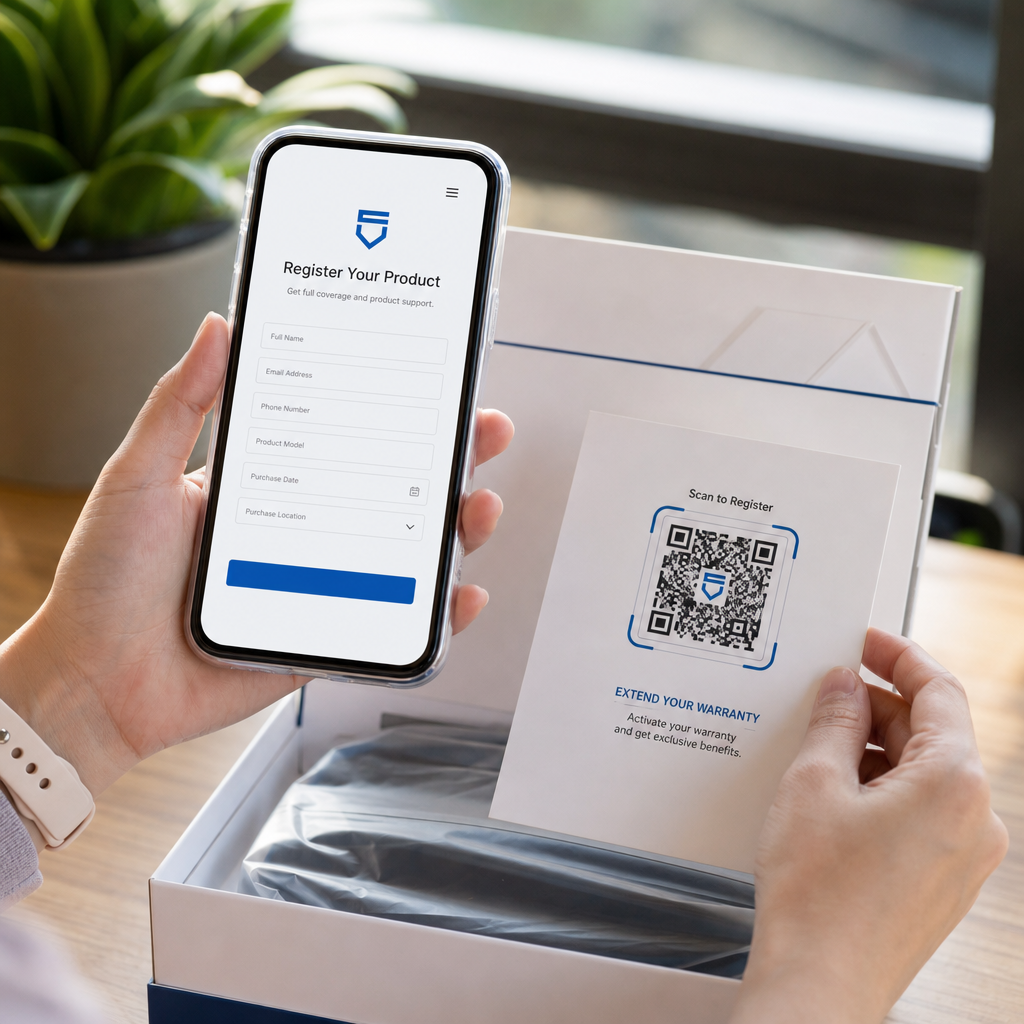
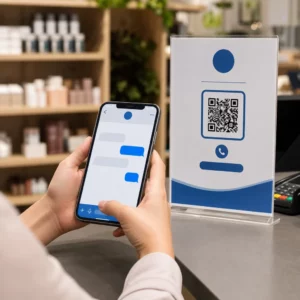
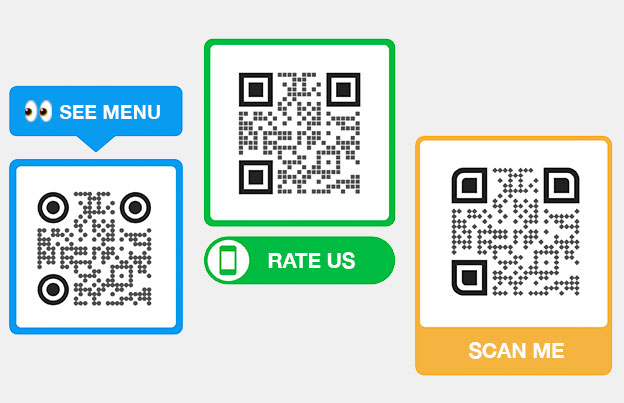
The text surrounding your QR code provides the necessary context for a user to interact with it. A generic “Scan Me” may be ignored, whereas a personalized or value-driven CTA can significantly move the needle. Testing high-performing QR code call-to-actions like “Scan for 15% Off” versus “Join the Loyalty Club” can result in a 40% increase in scan volume.
Strategic Placement and Environment
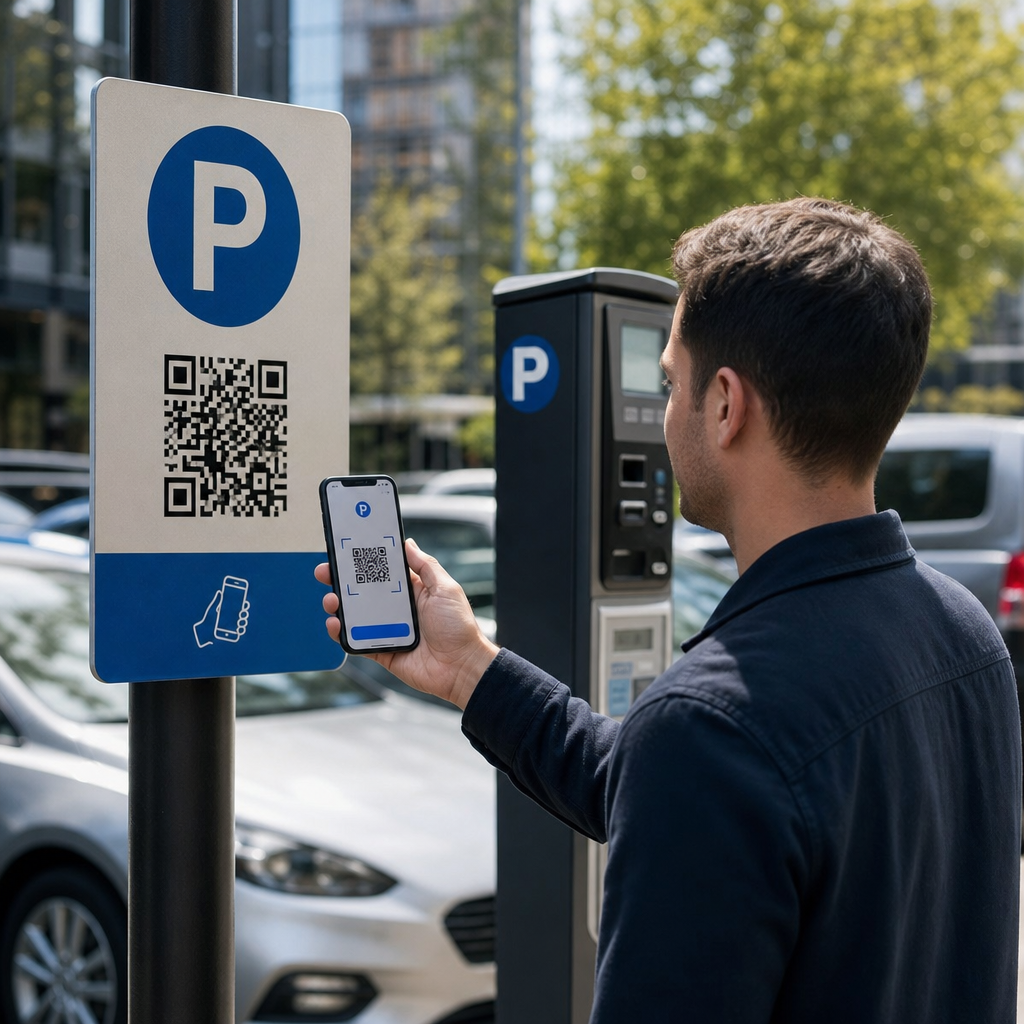
The physical location of your code is just as important as its design. You should test whether codes perform better at eye level (typically between 3.5 and 5.5 feet) or if placement on product packaging versus shelf-edge signage drives more traffic. Analyzing QR code placement helps you understand where users are most likely to have their phones ready and a stable internet connection for scanning.
Optimize Your Performance: Use a dynamic QR code generator to create editable codes that allow you to update destinations or designs instantly without the cost of reprinting.
Establishing a Structured A/B Testing Framework
A successful test requires a consistent methodology to ensure your data is statistically significant and actionable.
- Define a clear hypothesis: Start with a specific goal, such as “Adding a blue frame to the code will increase scans by 10% in our retail locations.”
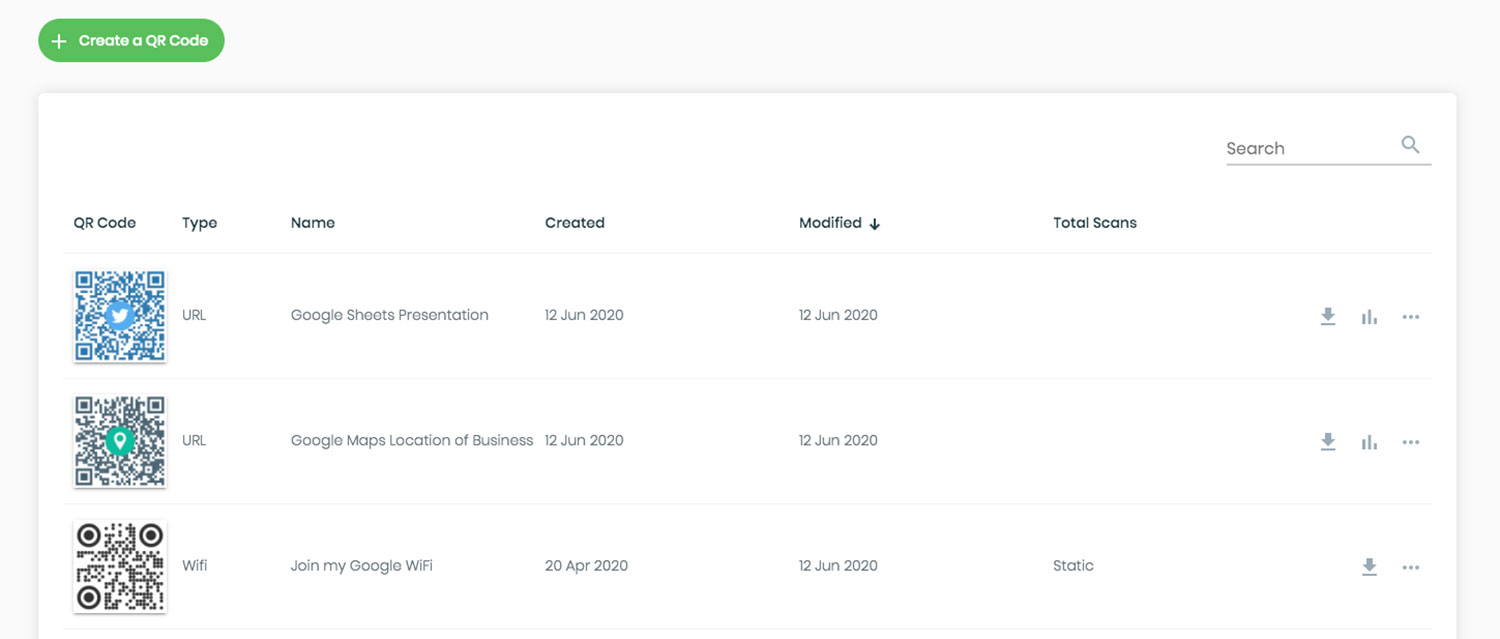
- Utilize dynamic technology: When comparing dynamic vs static QR codes, dynamic codes are superior because they provide the tracking infrastructure and flexibility needed for iterative testing.
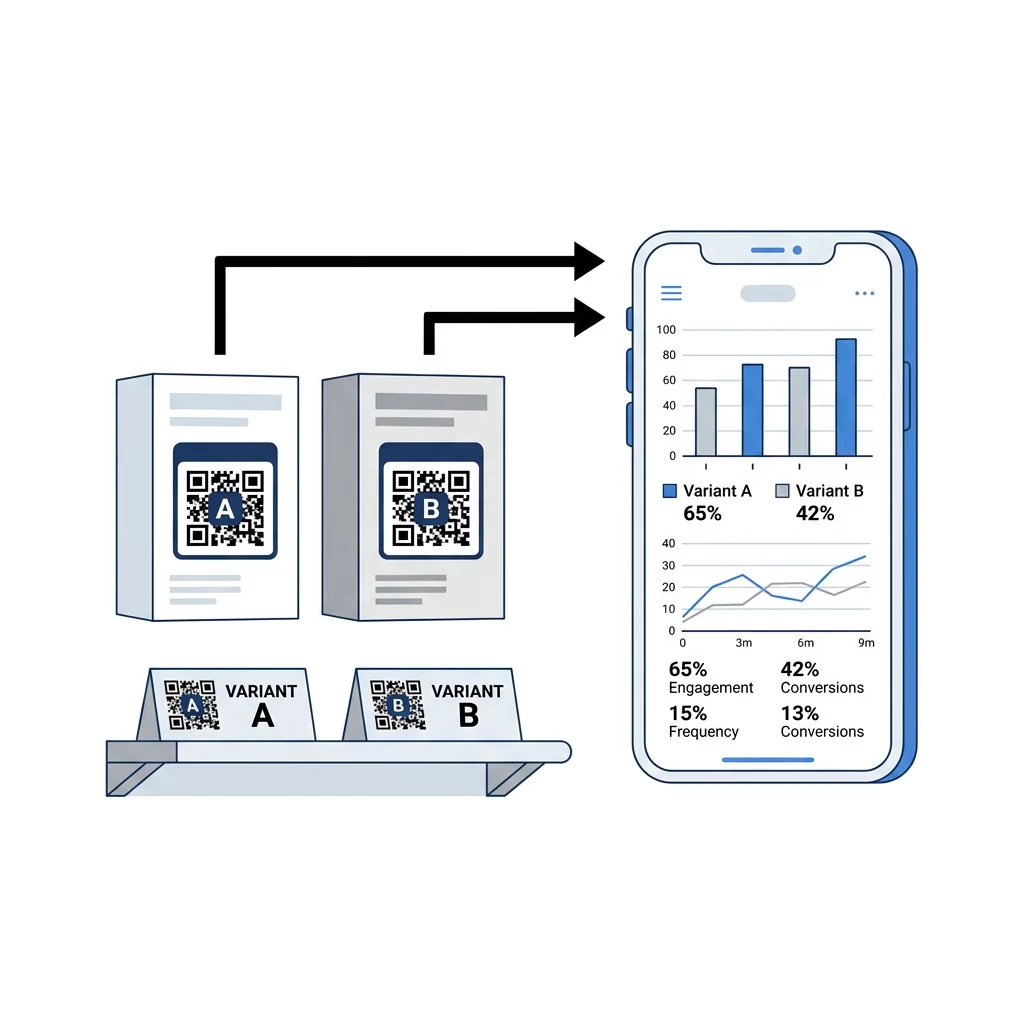
- Split your traffic evenly: Deploy Version A and Version B in similar environments or at the same time to ensure the comparison is fair.
- Monitor engagement metrics: Use a real-time QR code analytics dashboard to track unique scans, location data, and the specific devices used by your audience.
- Iterate based on results: Once you reach a sample of at least 200 unique scans per variant, identify the winner and begin a new test on a different variable to continue optimizing.
Technical Standards to Ensure Valid Test Results
No marketing variable can overcome a technical failure. Before running an A/B test, verify that both variants meet the fundamental requirements for scannability. High contrast is the most critical factor; always use dark foreground colors on a light background to ensure scanners can easily read the data pattern.
You must also protect the “quiet zone,” which is the blank margin of at least four modules around the code. If text or images encroach on this space, the scanner may fail to recognize the code entirely. For sizing, a code should be at least 0.8 x 0.8 inches for close-range use. If you are adding a logo, utilize a higher error correction level (Level Q or H) to ensure the code remains functional even if part of the pattern is obscured.
Analyze Every Scan: Gain deep insights into user behavior and geographic trends with real-time QR code analytics to see exactly how your A/B test is performing.
Real-World Performance Benchmarks
Looking at successful brands provides a blueprint for what is possible with QR code optimization. Starbucks, for example, tied its QR loyalty program to its mobile app, and now these interactions account for 17% of all their U.S. transactions. This success is built on constant refinement of how the QR code is presented to the user during the checkout flow.
In the retail sector, IKEA utilized A/B testing for QR-driven augmented reality features. They discovered that users who engaged with these digital touchpoints had online baskets that were 27% larger than those who did not. Similarly, a cosmetics brand found that changing a generic link to a personalized CTA like “Find your skincare match” resulted in 40% more scans and significantly longer website session durations.
FAQ
You can only do this if you originally used dynamic QR codes. Because dynamic codes redirect through a server, you can change the destination URL or the design settings in your dashboard without needing to change the physical code that is already in the hands of your customers.
To achieve statistical significance, you should aim for at least 200 unique scans per variant. Running the test for at least two weeks is also recommended to account for fluctuations in user behavior during different days of the week.
While total scans tell you the overall volume, unique scans are more important for understanding reach. You should also monitor the conversion rate – the percentage of people who scanned the code and then completed the desired action on your landing page – to measure true ROI. To start optimizing your own campaigns and turn physical touchpoints into digital conversions, use a link QR code generator to create your first set of testable, branded codes.


