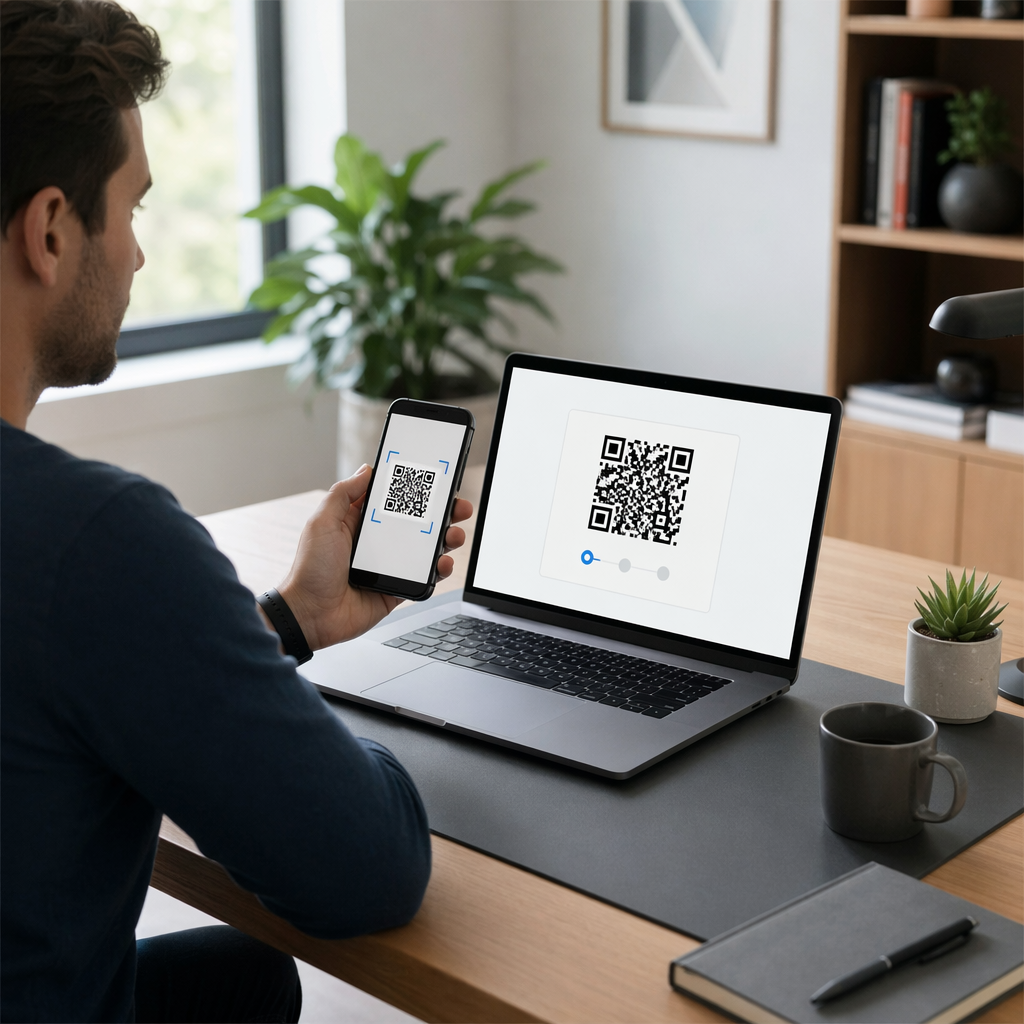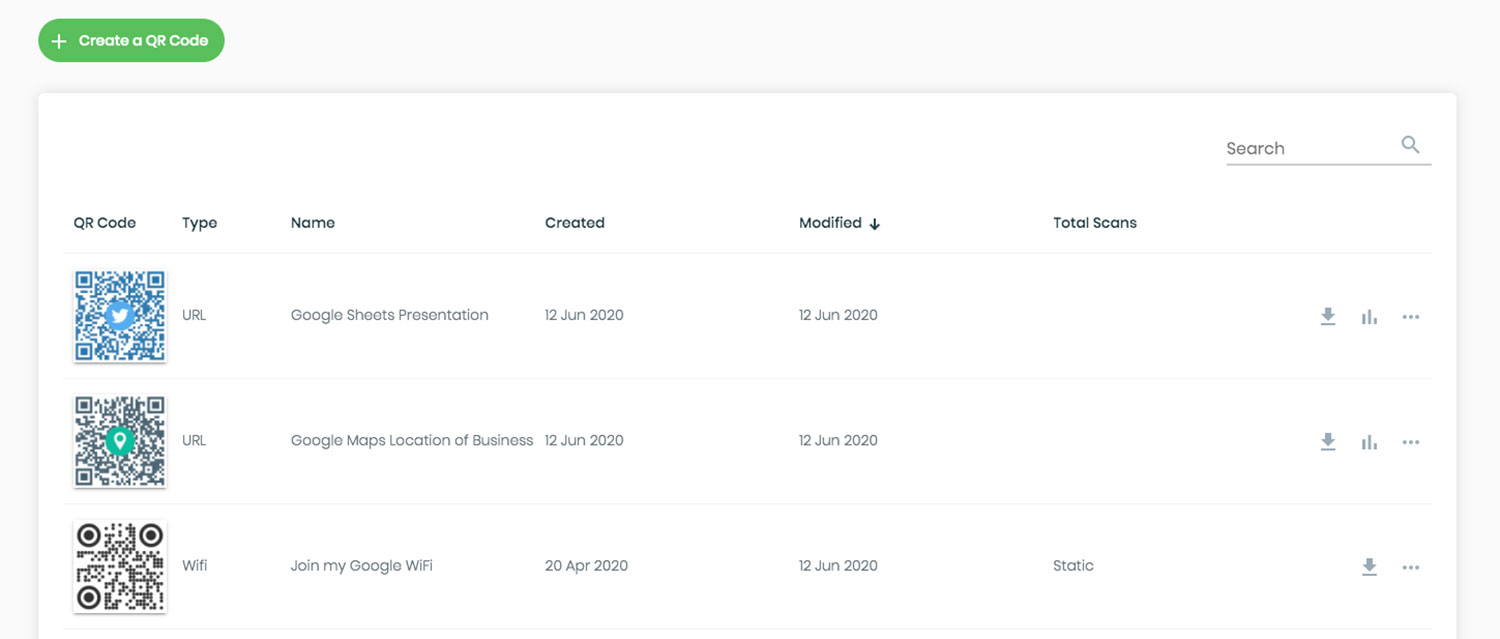
Are you wondering if your printed QR codes are actually driving sales or just taking up space? Without a dedicated tracking system, your offline marketing remains a mystery that prevents you from calculating your true return on investment. Using a QR code analytics dashboard allows you to monitor every interaction in real-time and turn raw scan data into actionable marketing insights.
Why a Centralized Dashboard is Essential for Marketing
A centralized dashboard acts as the command center for your physical-to-digital campaigns by bridging the gap between offline materials and online results. While static QR codes are permanent and cannot be monitored, dynamic QR codes for marketing route users through a tracking server before reaching the final destination. This invisible “middleman” step allows the platform to log critical data points without the user experiencing any delay.
By using a dashboard, you can calculate ROI by connecting physical touchpoints like flyers or packaging to digital conversions. It also enables you to update content instantly, meaning you can change the destination URL of a code without reprinting your materials. Furthermore, this data helps you optimize your budget by identifying which locations or media channels are underperforming, allowing you to reallocate resources to high-traffic areas.
Critical Metrics for Evaluating Performance
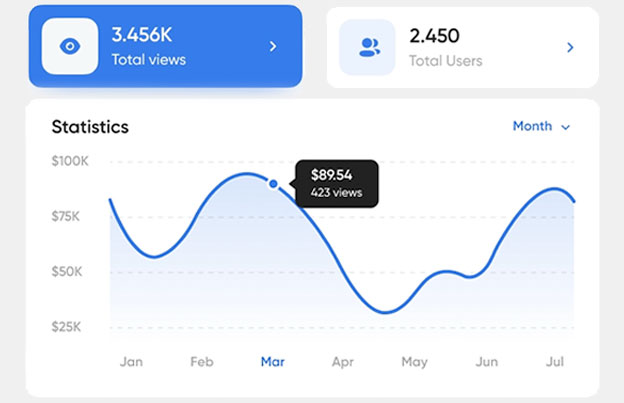
To truly understand campaign performance, you must look beyond raw scan counts and analyze the behavior behind the interaction. A professional enterprise QR code analytics dashboard provides several layers of data that help distinguish between general interest and meaningful engagement.
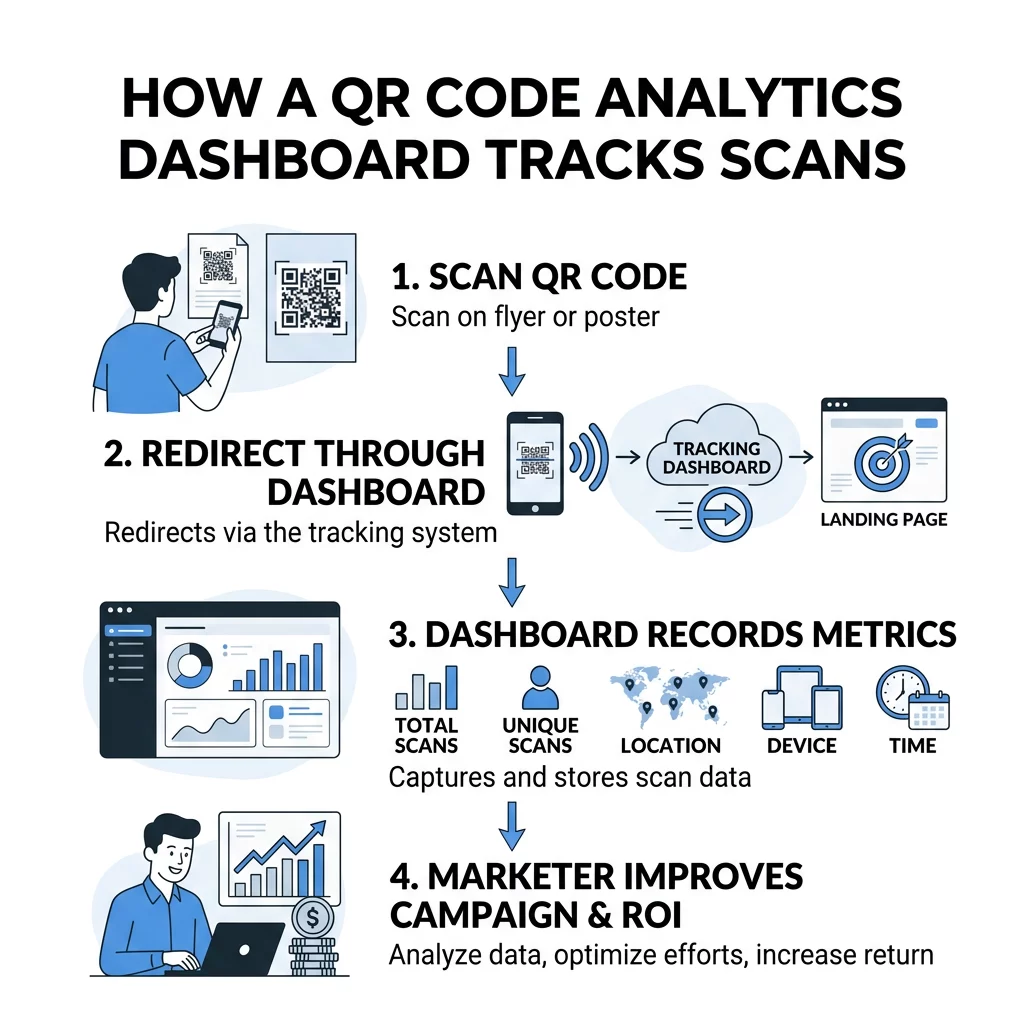
- Total versus Unique Scans: Total scans measure the overall reach and visibility of your code. Unique scans track individual users to reveal the actual size of your audience. If unique scans are significantly lower than total scans, it may indicate that users are struggling with your landing page and scanning multiple times to find information.
- Geographic Location Data: Most dashboards identify the city or country of the scanner with 50–70% accuracy using IP-based tracking. For more precise, meter-level data, you can implement geolocation analytics for QR codes, though this requires explicit user consent via their mobile device.
- Scan Timing and Patterns: Identifying peak engagement hours, such as lunch breaks for restaurant menus or evening hours for home-delivered catalogs, helps you schedule future promotions or staff your physical locations more effectively.
- Device and Operating System Details: Knowing whether your audience uses iOS or Android allows you to optimize your landing page design or direct users to the correct version of your mobile app.
Ready to see your data in action? Create your first trackable campaign today with our QR code generator and get real-time insights into every scan with a 14-day free trial.
Step-by-Step Configuration for Accurate Insights
Before you print thousands of marketing materials, you must ensure your tracking infrastructure is configured to capture the right data. Setting up your dashboard correctly from the start prevents data gaps and ensures that your reports are reliable.
- Select Dynamic Code Options: Always choose the dynamic option when using a link QR code generator. Static codes cannot be tracked or edited once they have been printed, which limits your ability to gather long-term data.
- Implement UTM Parameters: Add UTM tags such as source, medium, and campaign to your destination URL. Utilizing UTM parameters for QR codes allows you to see QR-driven traffic alongside your social media and search traffic in tools like Google Analytics.
- Establish SMART Goals: Define specific success metrics before launching, such as a targeted scan-to-conversion rate or a specific number of new email leads. Following the SMART goals framework for QR campaigns ensures your data analysis remains focused on business growth.
- Perform Multi-Device Testing: Scan your code with various devices and operating systems to verify that the redirect works correctly and that the dashboard logs the activity accurately before mass deployment.
Converting Dashboard Data into Strategic Actions
The real value of an analytics dashboard lies in your ability to pivot your strategy based on evidence. If your analytics show a high scan rate but a low conversion rate, the issue is likely not the QR code placement but the quality of the landing page or the offer itself.
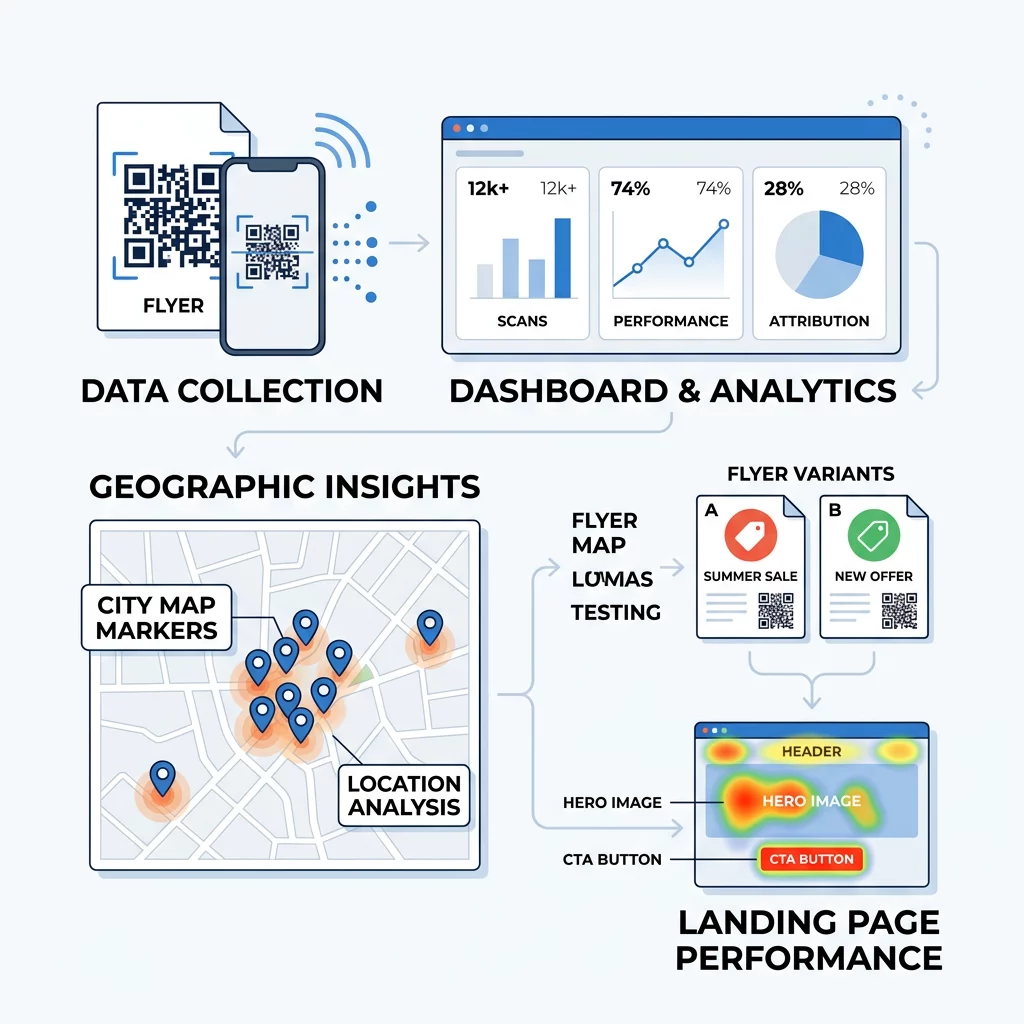
- Conducting A/B Tests: You can print two versions of a flyer with different calls-to-action to see which one generates more unique scans. The dashboard provides the data necessary to determine which design or messaging resonates best with your audience.
- Refining Regional Targeting: If geographic data shows high engagement in one specific city, consider launching a localized ad campaign or opening a physical pop-up shop in that area to capitalize on the existing interest.
- Analyzing Engagement Heatmaps: Combine your scan data with landing page heatmaps to see exactly where users click or lose interest after they scan. This helps you identify if the user journey is being interrupted by a confusing layout or a broken link.
By connecting your QR code dashboard to your broader analytics suite, you can follow the entire customer journey from the moment they scan a physical poster to the moment they complete a purchase. This bridge between the physical and digital worlds is the foundation of modern, data-driven marketing.
FAQ
You can only track scans if you originally used a dynamic QR code. Static QR codes have the destination data hard-coded into the pattern and do not route through a tracking server, which makes them impossible to monitor or edit after they have been printed.
Standard IP-based tracking is generally 50–70% accurate at the city level, providing a solid overview of regional performance. If your campaign requires precise location data within a few meters, you must enable GPS tracking, which requires the user to grant permission on their mobile browser upon scanning.
A scan represents the initial interaction where a user opens your link, serving as a measure of awareness. A conversion is when that user takes a specific action, such as signing up for a newsletter or making a purchase; tracking both is necessary to calculate the true effectiveness of your marketing funnel. Are you ready to stop guessing and start measuring the impact of your campaigns? Use the Pageloot analytics dashboard to monitor your QR codes in real-time and optimize your marketing for maximum engagement and ROI.