
Do you know which physical locations are actually driving your QR code scans – and which ones are dead weight? Without location-level data, you’re guessing. This guide explains how AI-powered analytics measure QR code engagement by geography and how you can use those insights to improve campaign performance.
Why Location Data Matters for QR Code Campaigns
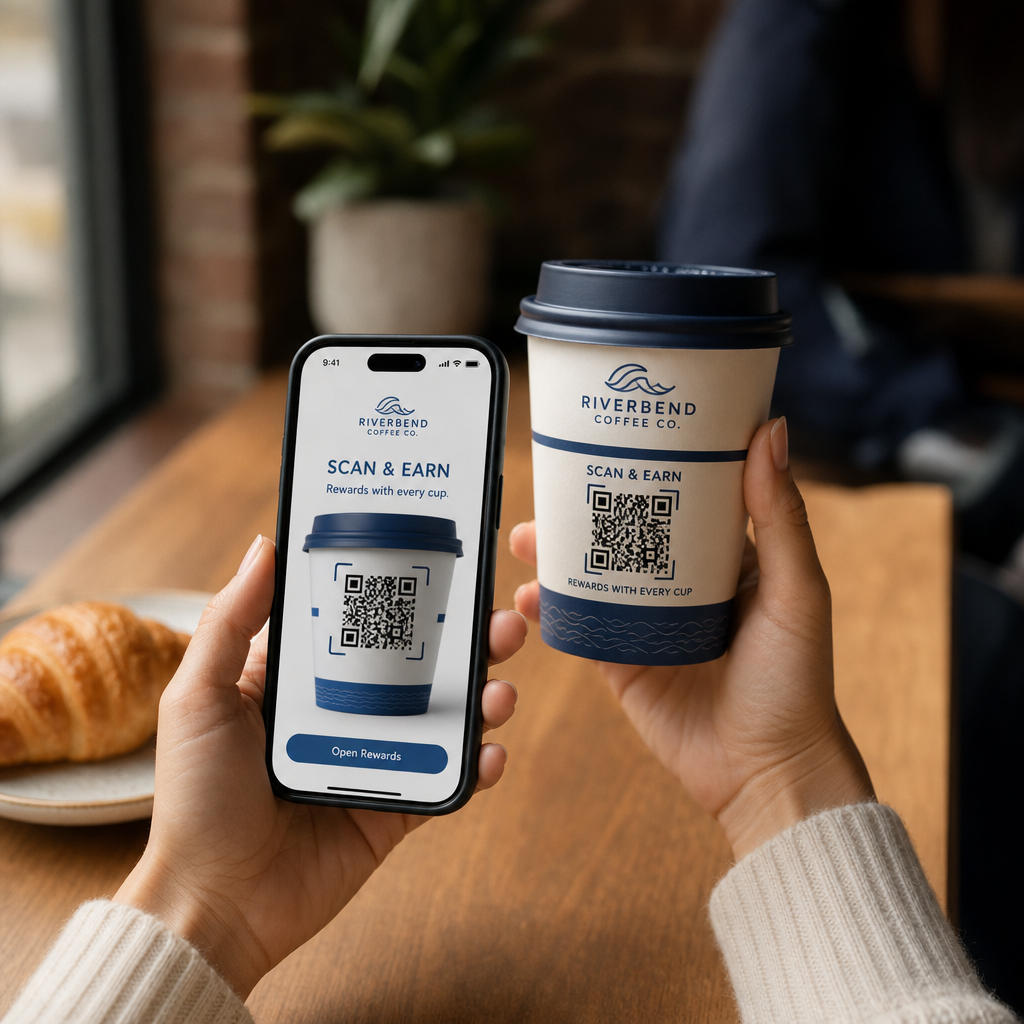
QR codes appear on posters, packaging, signage, menus, and event materials. Each placement exists in a different physical environment with a different audience. Without location-level data, you can see that a campaign got 500 scans – but you can’t tell whether those came from your storefront display, your transit ad, or a trade show booth.
Location tracking answers that question. It tells you which placements are working, when they generate the most activity, and how engagement varies across regions or venues. That information feeds directly into smarter decisions about where to place codes, what content to show, and when to run promotions.
According to eMarketer projections, U.S. smartphone users scanning QR codes were expected to grow from 83.4 million in 2022 to 99.5 million by 2025 – making accurate tracking increasingly important as the audience scales.
How QR Code Location Tracking Works
Location tracking is only possible with dynamic QR codes. Unlike static codes, which encode a fixed destination and record nothing, dynamic QR codes route each scan through an intermediary tracking server. That server logs data about the scan event – including time, device type, and location – before redirecting the user to the final destination URL.
You can learn more about the full mechanics in the guide to how QR code tracking and analytics work.
There are two primary methods platforms use to determine where a scan occurred:
IP-based location tracking resolves a city and country from the IP address of the network the scanning device is connected to. This approach works automatically without requiring user consent and is effective for regional-level analysis. However, accuracy is limited – typically around 50–70% at the city level – and inconsistencies can occur when a device is connected to a cellular network registered in a different region.
GPS-based location tracking collects the exact coordinates of the scanning device. This method is far more precise, accurate to within a few meters, but it requires the user to explicitly grant location permission through a browser prompt. It’s the right choice for campaigns where precise placement data matters, such as large venue tracking or geofenced promotions.
For most campaigns, IP-based tracking provides sufficient regional insight. GPS-based tracking is reserved for use cases where exact coordinates are needed – and where you have a clear consent mechanism in place.
Start Tracking Scans by Location Need to know where your campaigns are generating engagement? Use the Dynamic QR Code Generator to create trackable codes and view scan data by country, city, and placement – all from one dashboard.
What Data Is Captured at Each Scan
Every scan of a dynamic QR code generates a set of data points. Collectively, these build a detailed picture of engagement that goes far beyond a simple scan count. The key metrics tracked include:
- Geographic location – country, region, and city derived from IP address, or precise GPS coordinates when consent is given
- Timestamp – exact date and time, enabling analysis of peak engagement periods across days and hours
- Device type and operating system – iOS vs. Android, mobile vs. desktop, specific device models, and browser type
- Network type – cellular vs. Wi-Fi, which can indicate whether users are stationary or in transit
- Scan frequency – total scans vs. unique scans, distinguishing repeat engagement from first-time interactions
Post-scan behavior – sessions, bounce rate, time on page, conversions – can also be tracked when QR codes are combined with UTM parameters for Google Analytics. This closes the loop between a physical scan and what happens on your landing page.
How AI Processes Location Data into Insights
Raw scan data becomes actionable through AI-driven analysis. Rather than requiring marketers to manually sort through scan logs, AI models process large volumes of location-linked data automatically and surface patterns that would be difficult to detect otherwise.
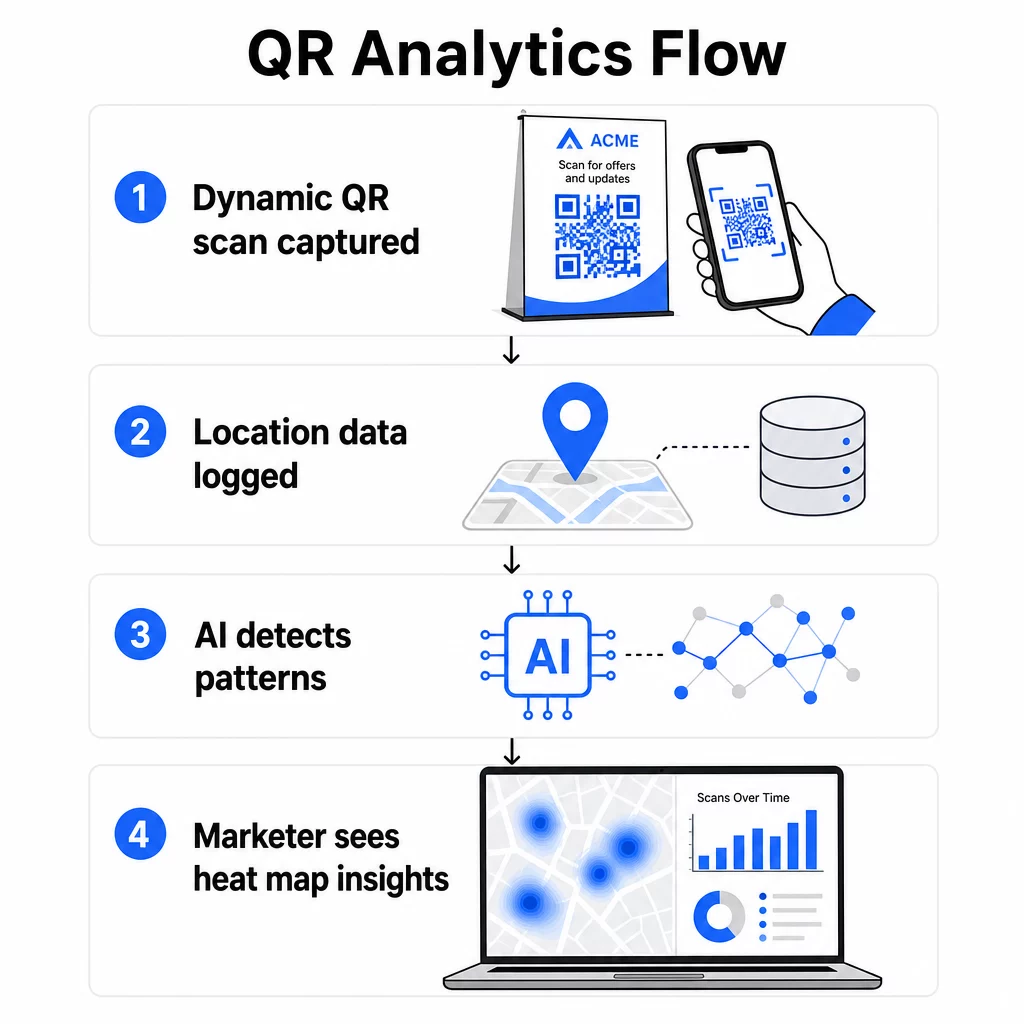
Geographic Heat Maps
Heat maps translate scan volume into visual representations of engagement density across locations. High-activity areas are immediately visible, making it straightforward to identify which placements are outperforming others. A retailer with QR codes across multiple store locations, for example, can see at a glance whether the flagship location is outperforming regional stores – or whether a specific in-store placement consistently drives more scans than others.
You can explore this approach in more depth in the guide to tracking QR code engagement with heatmaps.
Temporal Pattern Recognition
AI identifies when scans cluster by time of day, day of week, or seasonal period. A coffee shop might discover that morning scans come predominantly from repeat customers while afternoon scans attract new visitors. A museum might find that QR codes at entry points see heavy use in the first 30 minutes of opening. These patterns directly inform when to run time-sensitive promotions and how to staff locations during high-engagement periods.
Predictive Modeling
AI models trained on historical scan data can forecast future engagement trends by location. This enables proactive campaign adjustments – shifting budget toward high-performing locations before a seasonal peak, or identifying venues where engagement is trending downward before it affects overall campaign results.
Cross-Location Comparison
When a campaign spans multiple physical locations, AI enables direct performance benchmarking across venues. Marketers can identify which regions, store formats, or placement types consistently outperform others and replicate those conditions elsewhere.
AI-Powered Analytics vs. Traditional Methods
The practical difference between AI-driven tracking and older manual methods becomes clear when you compare them side by side.
| Feature | AI-Powered Analytics | Traditional Methods |
|---|---|---|
| Data collection speed | Real-time processing | Manual entry with hours or days of delay |
| Location accuracy | GPS and IP mapping | General estimates or manual logging |
| Pattern recognition | Automatic trend and anomaly detection | Manual analysis requiring significant time |
| Predictive capabilities | Forecasts from historical data | Limited to reporting past events |
| Cross-location analysis | Real-time comparison across venues | Requires separate systems per location |
| User journey mapping | Tracks full path from scan to conversion | Fragmented with missing touchpoints |
Traditional methods – basic scan counters, manual surveys, spreadsheet logs – are time-consuming and provide limited insight. AI-powered platforms process thousands of data points automatically, delivering a fuller picture without manual work.
Setting Up Location-Based QR Code Campaigns
The foundation of any location-based campaign is a dynamic QR code. Pageloot’s QR code generator lets you create codes with custom branding – your logo, brand colors, and design templates – while enabling full analytics tracking from the moment you deploy them.
Once created, dynamic QR codes can have their destination URL updated at any time without reprinting materials. This is particularly valuable for campaigns that evolve over time, allowing you to shift a seasonal promotion, test a new landing page, or redirect traffic to updated content without replacing physical signage.
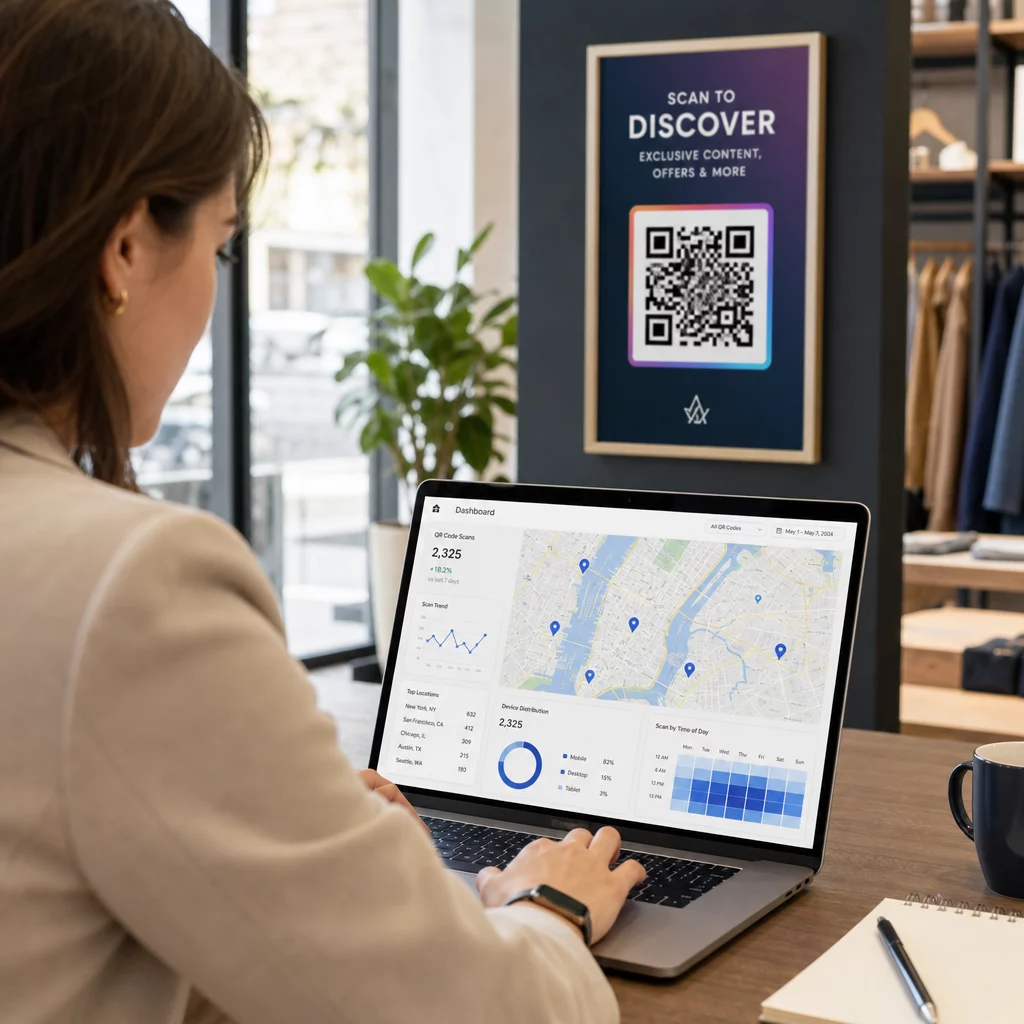
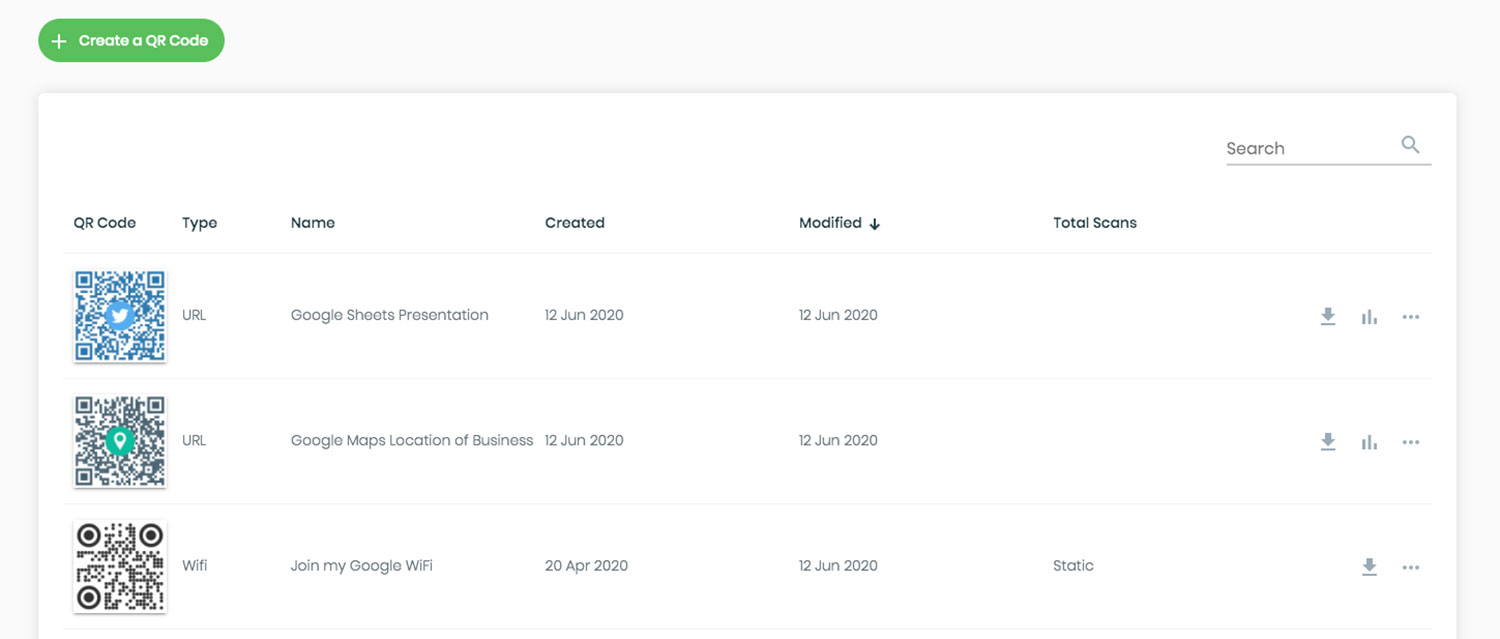
The analytics dashboard provides a centralized view of all scan data: total scans over time, geographic breakdowns by country and city, device type distribution, and placement-level comparisons. Filters by date range, location, or campaign type let you drill into the data that matters most for a given decision.
For more on configuring your dashboard and setting tracking parameters, see the guide to QR code analytics dashboards.
Practical Applications by Industry
Location-aware QR code tracking has concrete applications across a range of industries:
- Retail – Identify which in-store placements (entrance, fitting room, checkout) drive the most scans and use that data to time promotions or adjust staffing. Location-specific codes can deliver different offers based on where in the store a customer scans.
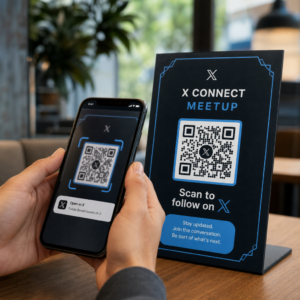
- Events and conferences – Track entry point usage, monitor crowd movement across session rooms, and gather attendance data without manual check-in processes.
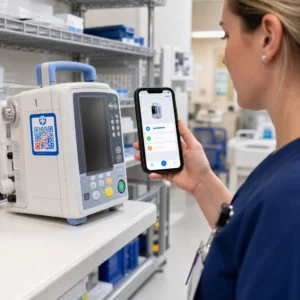
- Healthcare – Place QR codes at department entrances to track patient flow and identify bottlenecks in facility navigation.
- Hospitality – Monitor which tables, locations, or guest touchpoints generate the most digital engagement, then use that data to optimize menu placements or promotional materials.
- Education – Use campus-wide QR codes for navigation, resource access, and attendance tracking, with location data revealing which areas see the most engagement.
For multi-location businesses, AI-driven analysis across all venues can reveal patterns that wouldn’t be visible when looking at any single location in isolation.
Privacy and Compliance
Location data – particularly precise GPS coordinates – is classified as sensitive personal information under U.S. state privacy laws including CCPA and the Virginia Consumer Data Protection Act. These laws require clear disclosures about what data is collected, how it is used, and how users can opt out.
Practical compliance steps include:
- Using IP-based tracking by default, which doesn’t require consent
- Obtaining explicit browser permission before collecting GPS coordinates
- Anonymizing collected data so it cannot be linked back to individual users
- Applying data minimization – collecting only what’s necessary for the campaign objective
- Setting data retention limits and purging detailed location data after a defined period
Pageloot anonymizes scan data by default, with detailed location information gathered only through explicit consent prompts. The platform aligns with GDPR and CCPA compliance frameworks, automatically adjusting data collection practices based on applicable regional requirements.
For a detailed walkthrough of compliance implementation, see the guide on ensuring GDPR compliance in QR code analytics.
Best Practices for QR Code Placement
Even the best analytics can’t compensate for poor physical placement. Where you put a QR code determines what location data you collect and how many scans you actually generate.
- Place codes at eye level near natural stopping points – elevator banks, checkout counters, menu holders, and information kiosks
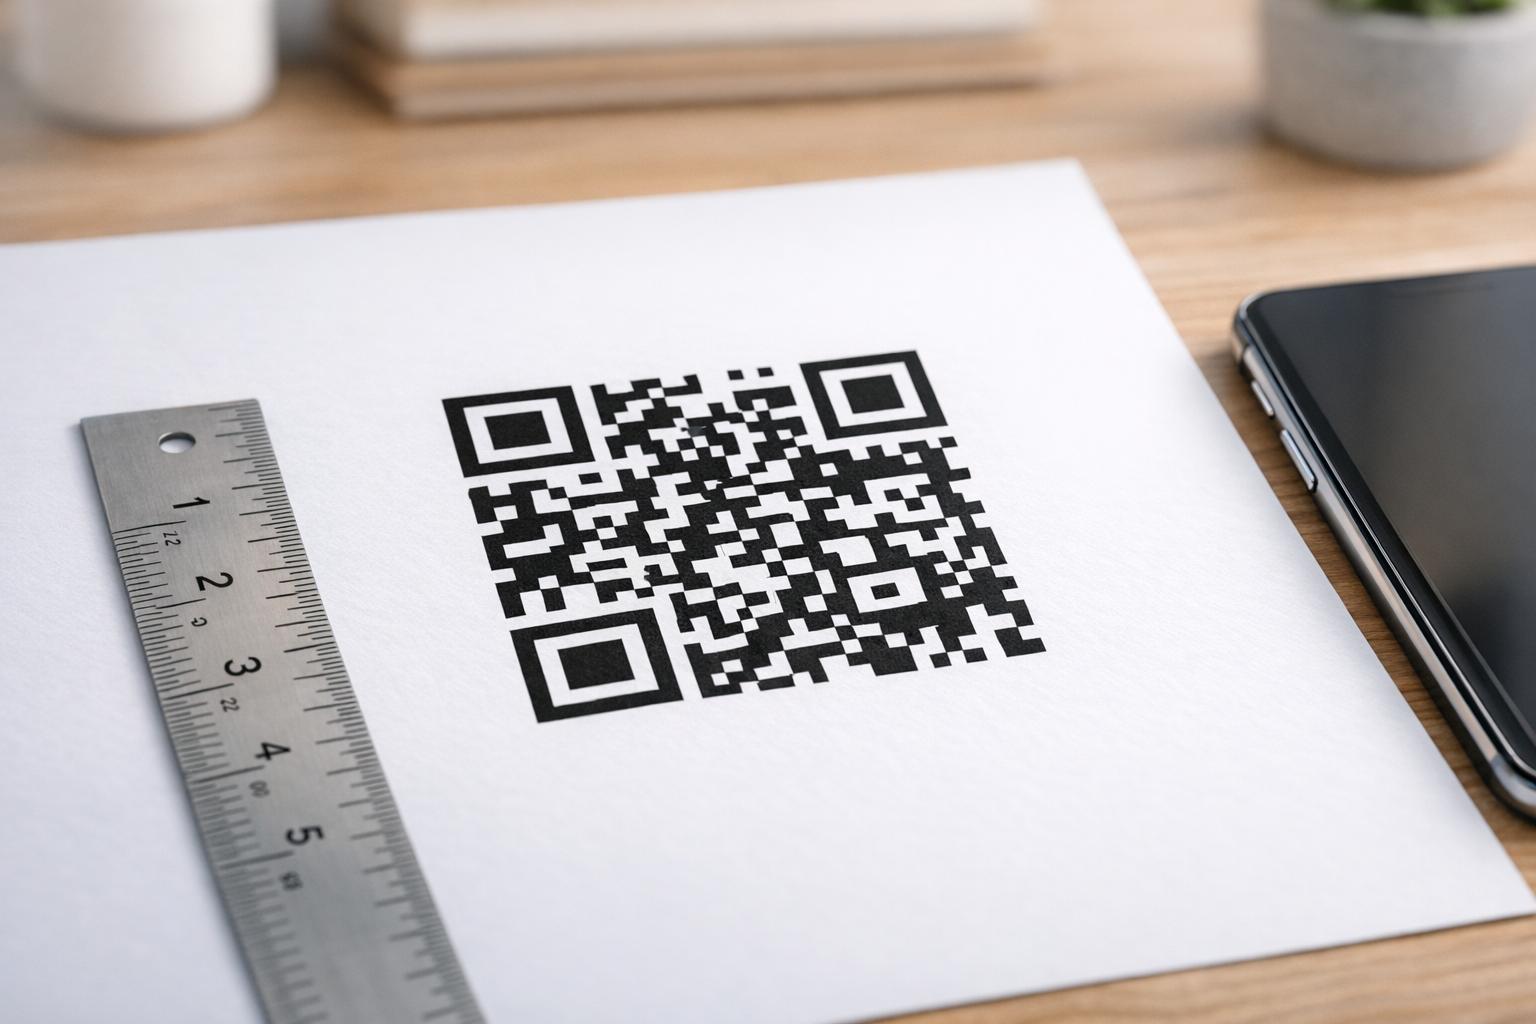
- Size codes appropriately: at least 1 × 1 inch for close-range scanning, 4 × 4 inches or larger for distance scanning
- Avoid placements with harsh shadows, direct sunlight, or low ambient light
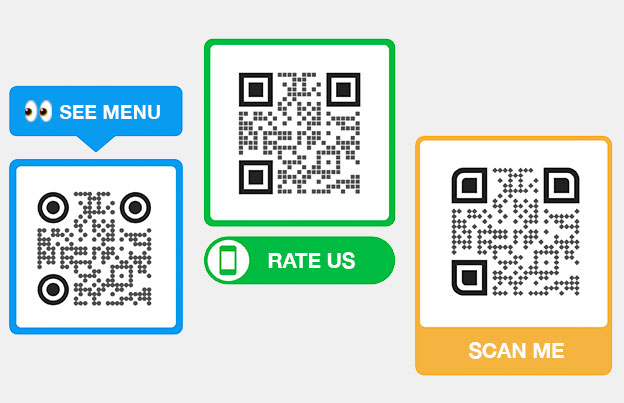
- Always include a clear call to action (“Scan for today’s menu,” “Scan to check availability”) so users understand why they should scan
- For multi-location campaigns, assign separate tracking parameters to each placement so your analytics can differentiate performance by location
Dynamic codes make it easy to run A/B tests across placements without reprinting. If video content performs better at one location and a PDF works better at another, you can update each code’s destination independently based on what the data shows.
See Which Placements Drive Real Engagement Use Pageloot’s analytics features to compare scan performance across every location, device type, and time period – and adjust campaigns based on what the data actually shows.
Using Location Insights for Marketing Automation
Real-time location data opens the door to automated, context-aware campaigns. AI can detect high-engagement locations and trigger targeted content for those areas. A geofenced campaign, for example, can serve different landing page content depending on exactly where a scan occurs – a museum visitor scanning near one exhibit receives information specific to that exhibit, not the museum’s homepage.
Location data also integrates with email and CRM platforms, enabling audience segmentation based on scan behavior and geography. Users who scan at a specific store location can be added to a relevant follow-up sequence, while users in different regions can receive content tailored to their market.
Retailers can use scan volume forecasts to anticipate busy periods and adjust staffing or inventory accordingly. Over time, the combination of historical location data and predictive modeling makes campaigns increasingly efficient – identifying where to focus resources before the next promotional cycle begins.
For more on how AI capabilities apply to QR campaigns broadly, see the article on how AI enhances QR code marketing campaigns.
What This Means for Your Campaigns
Location-based QR code tracking transforms vague scan counts into specific, actionable intelligence. You can identify which venues drive the highest engagement, when your audience is most active at each location, and how to allocate campaign resources accordingly. Dynamic QR codes make this tracking possible without reprinting materials, while AI-driven analytics surface patterns that manual methods simply can’t detect at scale.
The next step is creating dynamic QR codes with tracking enabled and deploying them across your locations. As scan data accumulates, the geographic and temporal patterns that emerge will give you a measurable basis for every future placement and campaign decision.
Explore Pageloot’s full range of features to see how QR code creation, analytics, and campaign management work together in a single platform.
Frequently Asked Questions
IP-based tracking determines scan location by resolving the city and country from the scanning device’s network IP address. It works automatically without user consent and is suitable for regional analysis, though accuracy is typically around 50–70% at the city level. GPS-based tracking collects precise coordinates from the device and is accurate to within a few meters, but it requires the user to explicitly grant location permission. IP-based tracking suits most campaigns; GPS-based tracking is best for use cases requiring exact placement data, such as geofencing or large venue crowd analytics.
Yes. Static QR codes encode a fixed destination and do not support any tracking. Dynamic QR codes route each scan through a tracking server that logs location, device type, timestamp, and other data before redirecting the user. Without a dynamic code, no scan data is recorded. You can create and manage dynamic QR codes with built-in analytics using Pageloot’s dynamic QR code generator.
In the United States, precise geolocation is treated as sensitive personal information under laws including CCPA and the Virginia Consumer Data Protection Act. Businesses must provide clear disclosures about what data is collected, offer opt-out mechanisms, and handle data securely. IP-based tracking generally does not require consent; GPS-based tracking does. Best practices include anonymizing collected data, minimizing what you collect to what’s necessary, setting data retention limits, and using a platform that supports GDPR and CCPA compliance frameworks. See the full guide on GDPR compliance in QR code analytics for implementation details.


