
Are you tired of guessing whether your offline marketing materials actually drive digital traffic? Without clear data, you are essentially flying blind and risking budget on placements that never convert. This guide explains how to use QR code analytics to measure real-time engagement and optimize every scan for better ROI.
Understanding Key Engagement Metrics
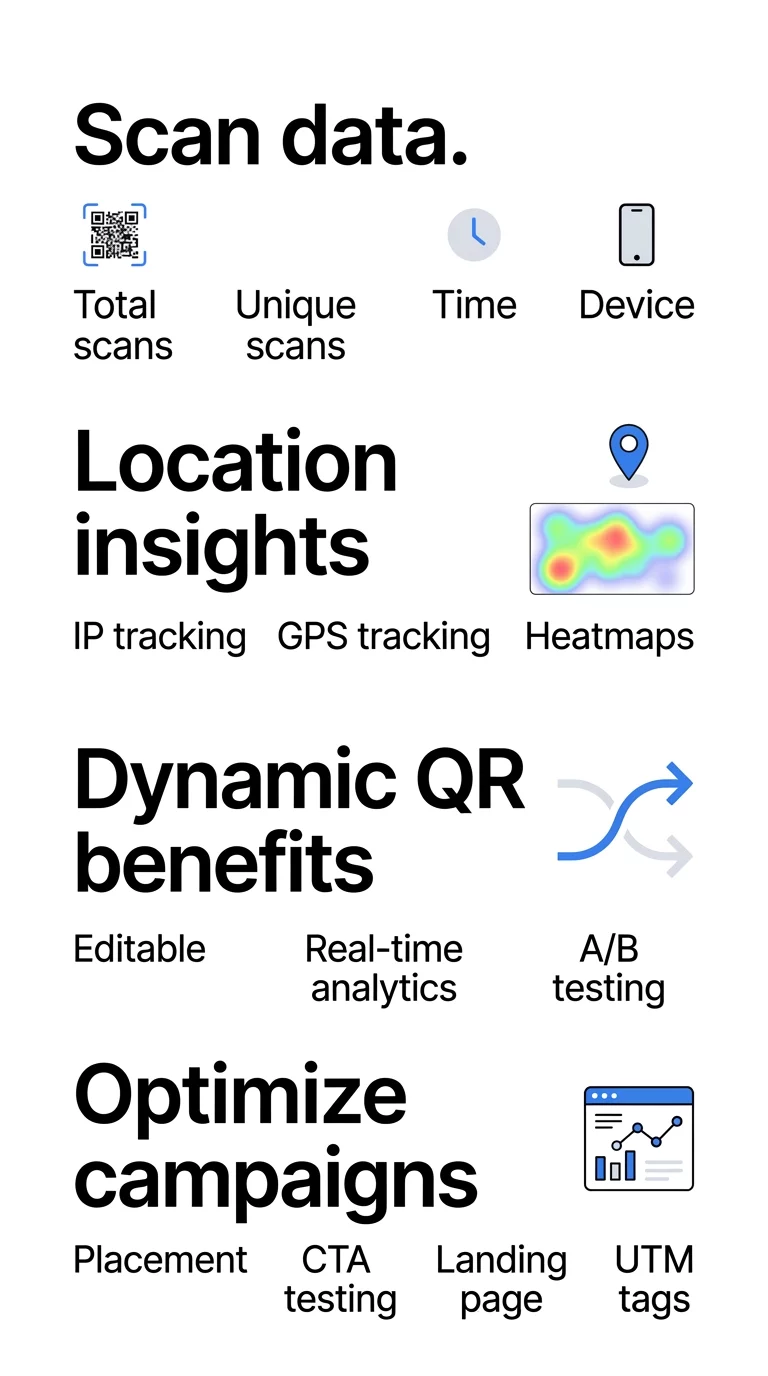
To evaluate the success of a campaign, you must look beyond a single number. Effective tracking for QR codes involves analyzing several data points that reveal exactly how users interact with your content.
- Total Scans: This represents the overall popularity of your code, counting every single interaction, including repeat scans from the same user.
- Unique Scans: This metric filters out repeats to show how many distinct individuals interacted with your campaign. If you have 1,000 total scans but only 200 unique ones, it suggests high repeat interest or perhaps a user journey that requires multiple visits to complete.
- Time-of-Scan: Timestamps identify peak activity hours and days. A coffee shop truck once discovered that most of its scans occurred near office parks during weekday lunch hours; by adjusting its schedule to match these peaks, it doubled its coupon redemptions.
- Device Type: This identifies whether your audience uses iOS, Android, or other platforms. For example, a fitness brand found that 70% of its scans came from Android devices, leading them to prioritize Android-specific features on their landing page to improve retention.
Visualizing Density with Heatmaps and Geolocation
Location-based analytics allow you to see exactly where your engagement is happening. This is essential for businesses with multiple storefronts or national distribution networks that need to justify their physical ad spend.
Most geolocation analytics for QR codes use two primary methods to gather data. IP-based tracking is automatic and provides 50–70% city-level accuracy without requiring user consent. GPS-based tracking is much more precise, offering accuracy within a few meters, but it requires the user to explicitly grant permission on their device. Think of IP tracking like knowing which city a person is calling from, while GPS is like seeing their exact street address.
Heatmaps take this data and turn it into a visual density map on your dashboard. Areas with high scan activity appear in “warm” colors like red or orange, while lower activity zones remain “cool” blue. During the 2024 Paris Olympics, organizers used GPS-enabled QR codes to monitor crowd movement across different zones in real-time, allowing for better logistics and security management.
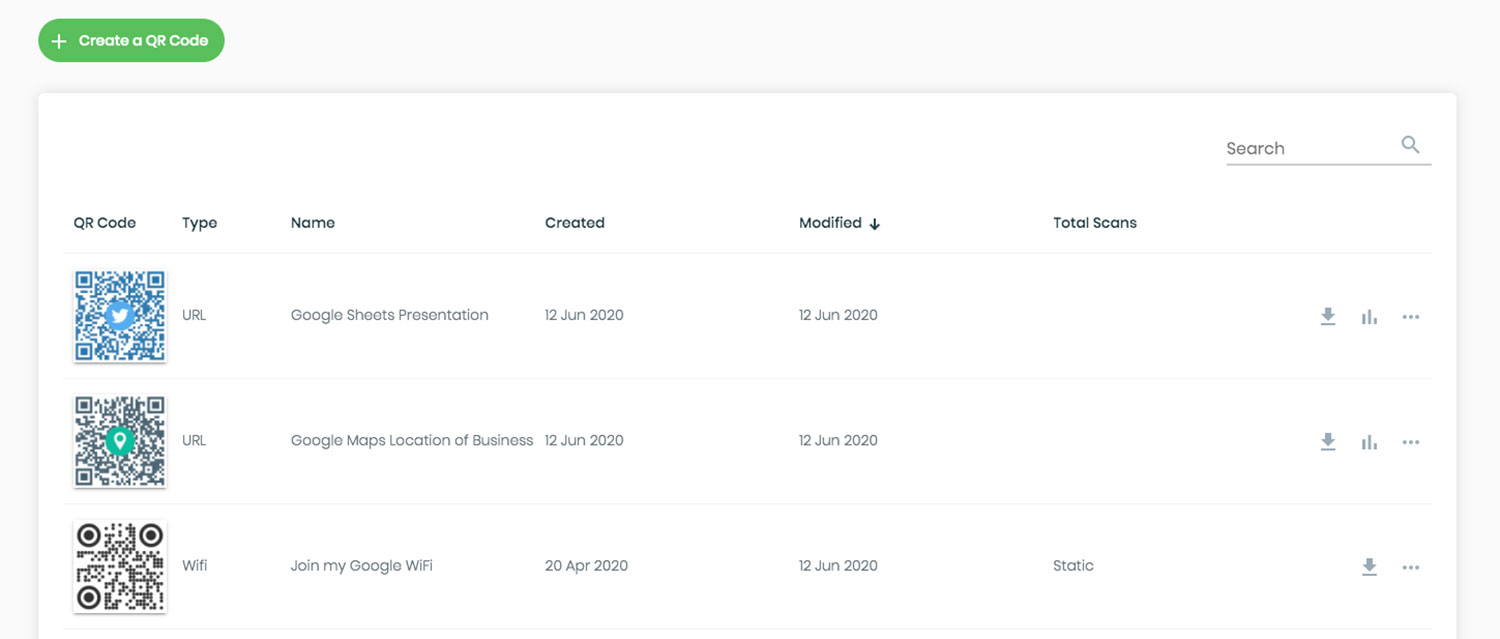
Monitor Your Campaign in Real-Time Want to see exactly where and when your customers are scanning your materials? Use the Dynamic QR Code Generator to create trackable codes and access a full performance dashboard today.
Why Dynamic QR Codes are Essential for Data
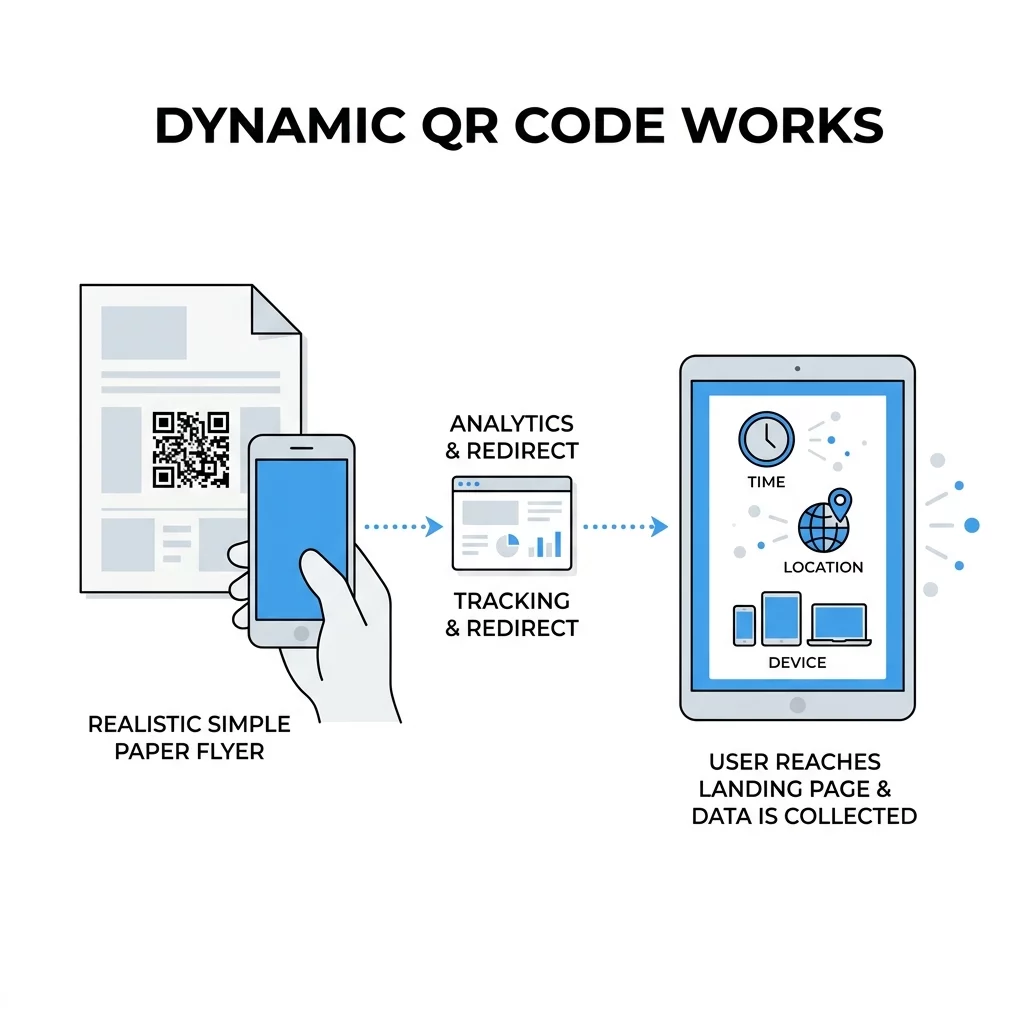
If you use a static QR code, the information is hard-coded into the pattern like ink on paper. Once it is printed, you cannot track it or change its destination. To gather any meaningful data, you must use dynamic codes.
Dynamic codes work by using a short redirect URL. When a user scans the code, they are briefly routed through a tracking server before arriving at the final destination. This “middleman” step allows the platform to log the scan time, location, and device type instantly. Because the code points to a redirect link rather than a fixed file or URL, you can update the content at any time without reprinting your flyers or packaging.
| Feature | Static QR Codes | Dynamic QR Codes |
|---|---|---|
| Editability | Fixed; cannot be changed after printing | Can be updated anytime without reprinting |
| Tracking | No analytics available | Real-time data (time, location, device) |
| A/B Testing | Not supported | Ideal for testing different URLs |
| Data Collection | Limited to the encoded content | Comprehensive user behavior insights |
Choosing between dynamic and static QR codes is often the difference between a successful, data-driven campaign and a one-off experiment that provides no feedback.
Privacy and Compliance for Marketers
When you collect scan data, you must comply with privacy regulations like the California Consumer Privacy Act (CCPA) and GDPR. In the U.S., the CCPA gives residents the right to transparency regarding what data is collected and how it is used, with penalties reaching $7,500 per violation.
Best practices for marketers include being transparent about data collection in your privacy policy and obtaining explicit consent before gathering precise GPS coordinates. Most QR code software for businesses anonymizes personal data while still providing the geographic and behavioral trends you need to improve your strategy.
Optimizing Campaigns Based on Real-Time Data
Data is only valuable if you use it to refine your tactics. With real-time QR code tracking, you can make adjustments mid-campaign to save costs and boost engagement.
- Refine Placement: If your heatmap shows low engagement for a specific poster, move it to the upper half of the display or a higher-traffic area.
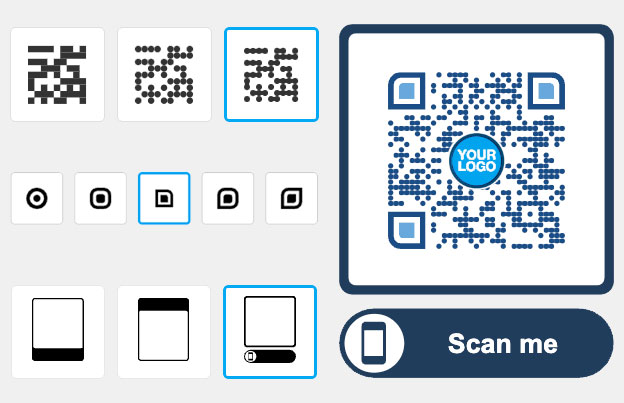
- A/B Test Your Creative: Use two different codes to test which call-to-action (CTA) or color scheme generates more unique scans. Custom-branded codes can achieve a 37% click-through rate, which is significantly higher than generic black-and-white patterns.
- Improve the Landing Page: If you see high scan counts but low conversions, the problem is likely your mobile site. Reducing form fields from 11 to 4 can increase conversions by 120%.
- Integrate UTM Parameters: By using UTM parameters for QR codes, you can track exactly which physical touchpoint led to a specific website purchase within Google Analytics.
FAQ
Total scans count every time the code is opened, including multiple scans by the same person. Unique scans count each distinct device only once, providing a clearer picture of your actual audience reach.
This is only possible if you used a dynamic QR code. Static codes are permanent and do not route through a tracking server, meaning they cannot provide analytics or be updated after they are printed.
IP-based tracking is generally 50–70% accurate at the city level and does not require user consent. GPS-based tracking is accurate within a few meters but requires the user to explicitly share their location after scanning. ### Start Measuring Your Success Stop guessing and start measuring the impact of your marketing. By using dynamic QR codes and analyzing scan data, you can turn every physical touchpoint into a source of digital insight. Create your first trackable campaign with the Pageloot QR Code Generator and see your engagement results in real-time.


