
Are you launching QR code campaigns but struggling to see if they actually drive digital traffic? Running a marketing campaign without data is like driving at night with the headlights off, leaving you unsure which physical touchpoints generate a return on investment. This guide explains how to use real-time tracking to transform offline interactions into measurable digital insights.
The Foundation: Dynamic vs. Static QR Codes
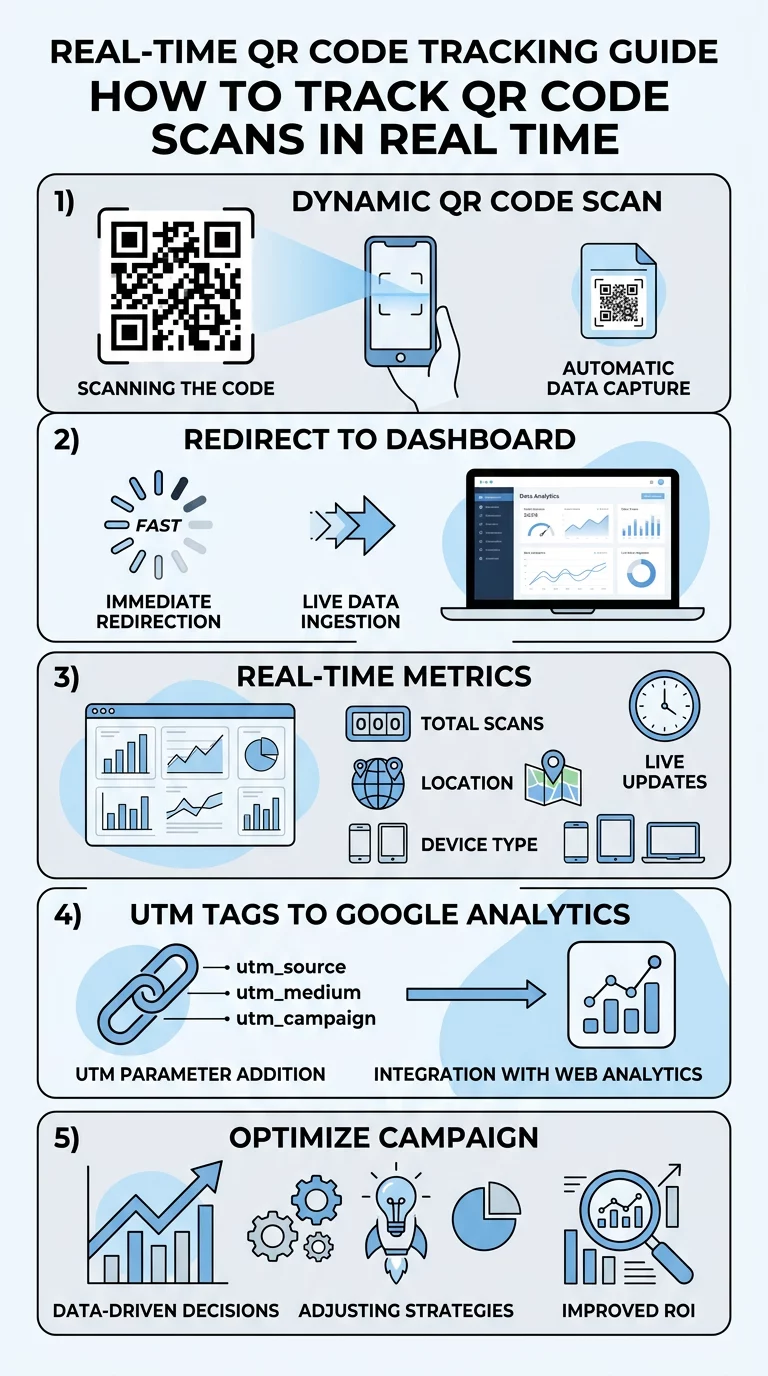
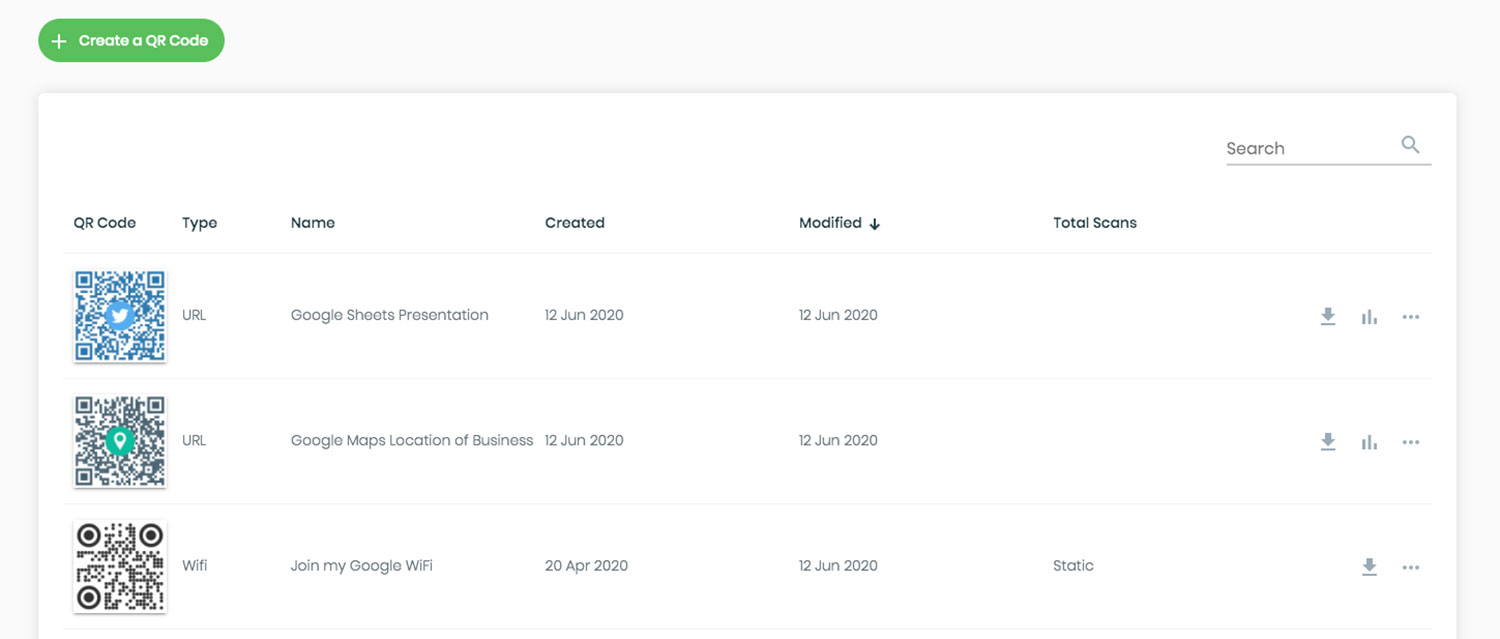
The first step in tracking is choosing the right technical infrastructure for your campaign. While static vs dynamic QR codes might look identical to the naked eye, their internal logic is fundamentally different. Static codes encode information directly into the square pattern, meaning the data is fixed and cannot be tracked because there is no server acting as a middleman during the scan.
In contrast, a dynamic QR code generator creates a short redirect URL. When a customer scans the code, they are briefly routed through a management platform before landing on your destination page. This split-second redirect allows the platform to log essential data points instantly. For any professional campaign, this flexibility is essential because it allows you to edit your QR codes after they have been printed without needing to change the physical design on your materials.
Key Metrics to Monitor in Your Dashboard
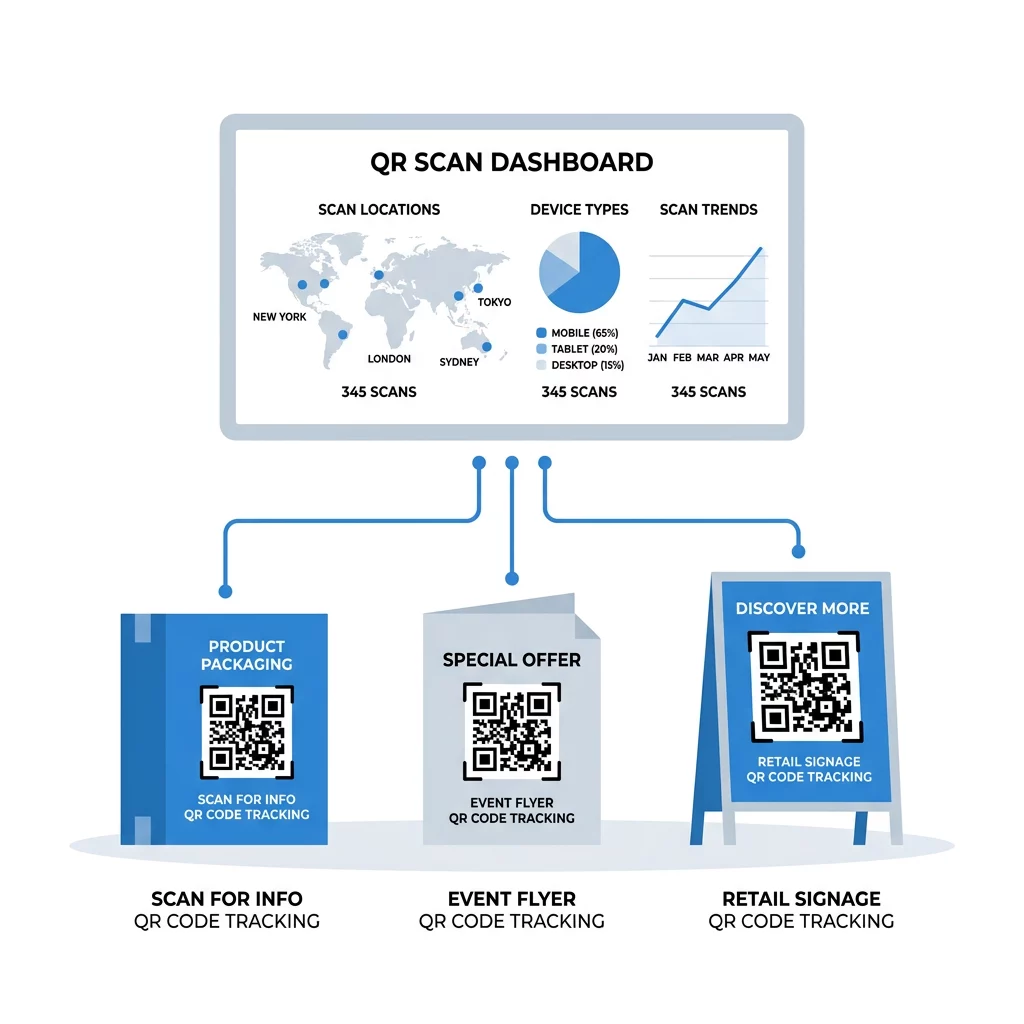
When you use a professional analytics platform, you gain access to a real-time dashboard that provides a bird’s-eye view of your campaign health. You can distinguish between total scans and unique scans to understand the difference between repetitive engagement and your actual overall reach. This distinction is vital for determining if a small group of users is scanning multiple times or if you are successfully reaching a broad new audience.
Geographic data allows you to track scans by country and city, providing essential context for businesses using QR codes on vehicles or across multiple signage and banners to identify which regions are most active. Additionally, device and operating system reports help you determine if your audience uses iOS or Android, which is critical for optimizing the post-scan landing page. Real-time tracking also reveals time-based trends, highlighting peak scanning hours so you can align your physical promotions with the moments your audience is most likely to engage.
Optimize Your Campaigns Today Stop guessing and start measuring. Use Pageloot’s QR code analytics to see exactly where, when, and how your customers are engaging with your brand in real-time.
Integrating with Google Analytics and UTM Parameters
While a dedicated dashboard provides excellent scan-level data, you likely want to see what happens after the user arrives at your website. This is where UTM parameters for QR codes become invaluable. By appending specific tags to your destination URL, such as identifying the source as a “flyer” and the medium as a “qr_code,” you can track the user’s entire journey within Google Analytics 4 (GA4).
This integration allows you to measure the conversion rate, which typically ranges from 2% to 5% for successful campaigns. Combining dynamic QR codes with UTM links ensures that your offline marketing efforts are no longer siloed. Instead, they become a fully integrated part of your digital ecosystem, allowing you to attribute sales, sign-ups, or downloads directly to a specific physical advertisement.
Real-World Tracking Applications
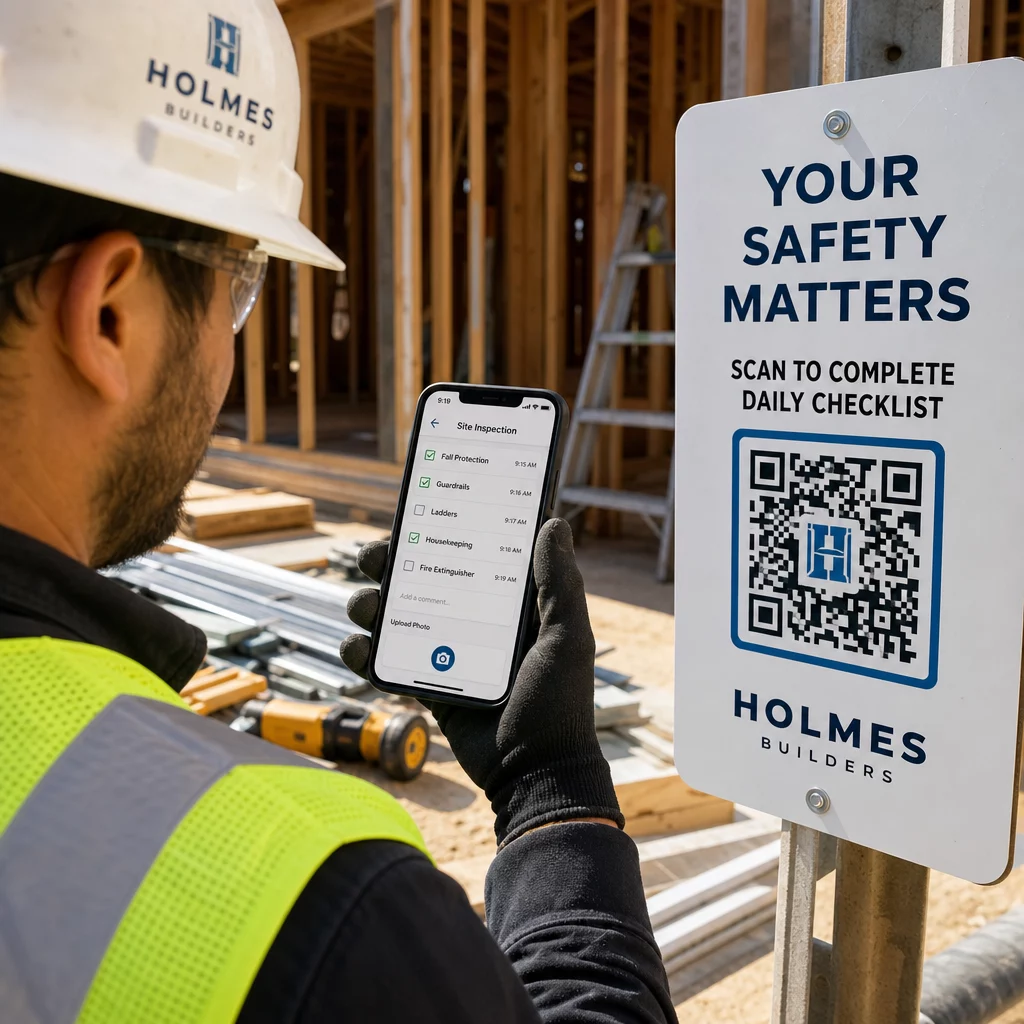
Tracking is a versatile tool that applies to various physical touchpoints beyond simple website links. For instance, approximately 57% of customers scan QR codes on product packaging to find specific product details or reviews. By monitoring these scans, brands gain a clearer understanding of which items in their inventory spark the most curiosity and engagement from shoppers.
When deployed on flyers, businesses often report higher engagement rates – sometimes up to 30% – compared to standard print ads that lack interactive elements. To further refine performance, you can implement A/B testing for QR codes by placing two different designs or calls-to-action in the same environment. This method allows you to see which version captures more attention in real-time, providing a fast and reliable way to improve your overall marketing return on investment.
Privacy and Compliance in Tracking
As you collect scan data, you must remain compliant with privacy regulations like GDPR and CCPA. Most geolocation analytics use IP-based tracking to provide city-level accuracy without requiring the user to share their precise GPS coordinates. This approach balances the need for marketing insights with user privacy, as it does not collect personally identifiable information by default.
If your campaign requires precise GPS coordinates within a few meters, you must obtain explicit user permission through a browser prompt before the data is captured. You should always ensure your QR code analytics are GDPR compliant by being transparent about what data you collect and providing clear privacy notices. Using a secure platform helps manage this transparency by offering built-in tools for data minimization and consent management.
Regularly monitoring your scan data allows you to move beyond guesswork and make data-driven decisions that grow your business. By selecting the right QR code placement and using dynamic tracking, you turn every printed material into a sophisticated data source. Start measuring your physical marketing performance today to see exactly how your offline efforts are driving digital growth.
FAQ
Tracking is only possible if you used a dynamic QR code for your campaign. Static codes have fixed data and do not route through a server, which prevents any data collection. For all future campaigns where tracking is required, ensure you use a dynamic QR code generator. What is the average scan rate for a QR code? While results vary significantly by industry and placement, the benchmark for QR code click-through rates is approximately 12.80%. You can improve this rate by using high-contrast designs, prominent placement, and a clear call-to-action that tells the user exactly what they will receive after scanning. Do I need Google Analytics to see my scan data? You do not strictly need Google Analytics to see basic metrics. Most professional platforms provide a built-in analytics dashboard that displays total scans, locations, and device types. However, connecting to Google Analytics is recommended if you want to track what users do on your website after the scan, such as completing a purchase.


