
How can your marketing team prove the value of physical campaigns without clear digital attribution? When offline touchpoints like signage and packaging remain unmeasured, you lose the ability to justify budgets or optimize the customer journey at scale. This guide explains the essential analytics metrics and tracking integrations needed to turn physical interactions into actionable digital insights.
Connecting Physical Touchpoints to Digital Insights
Enterprise marketing requires a higher level of data consistency than small-scale deployments because you are often managing thousands of assets across various regions. Without a centralized tracking system, these offline elements act as a “black box,” making it impossible to see which creative designs or locations actually drive revenue. By utilizing advanced tracking, you can bridge the gap between a customer holding a physical product and their eventual conversion on your website.
The foundation of this visibility is the use of dynamic codes. Unlike static versions that embed a permanent link, dynamic options allow you to change the destination URL at any time without reprinting your materials. These codes typically deliver three to four times higher engagement because they enable real-time campaign adjustments based on performance. For example, the M+ Museum achieved a 76% engagement rate by leveraging the flexibility of dynamic tracking.
Centralize your campaign management. Use a professional QR code generator to manage, update, and analyze all your physical touchpoints from a single, secure dashboard.
Core Analytics Metrics for Enterprise Success
To move beyond simple scan counts, you must focus on metrics that reflect genuine engagement and financial impact. While total scans show overall visibility, unique scans are more critical for understanding your actual audience reach. This metric uses deduplication logic to distinguish between a single person scanning a code multiple times and a broad group of individual users. By comparing unique scans to your total scan volume, you can determine the retention rate and how often customers return to interact with your brand.
Measuring the scan-through rate (STR) provides a direct look at how well your call-to-action and placement are performing. On average, these campaigns see a 12.80% engagement rate, which often outperforms traditional digital channels. You should also analyze scan timing patterns to optimize resource allocation. One mobile coffee truck operator doubled their redemptions by analyzing scan times near office parks, allowing them to adjust their physical schedule to match peak engagement periods.
Geographic data and device insights further refine your strategy. Knowing whether your audience is scanning from a specific metropolitan area or using a particular mobile operating system allows you to localize marketing efforts and optimize landing pages for the best user experience. When these metrics are combined with conversion tracking, you can calculate the Revenue per Thousand Scans (RPM), finally tying offline interactions directly to your bottom line.
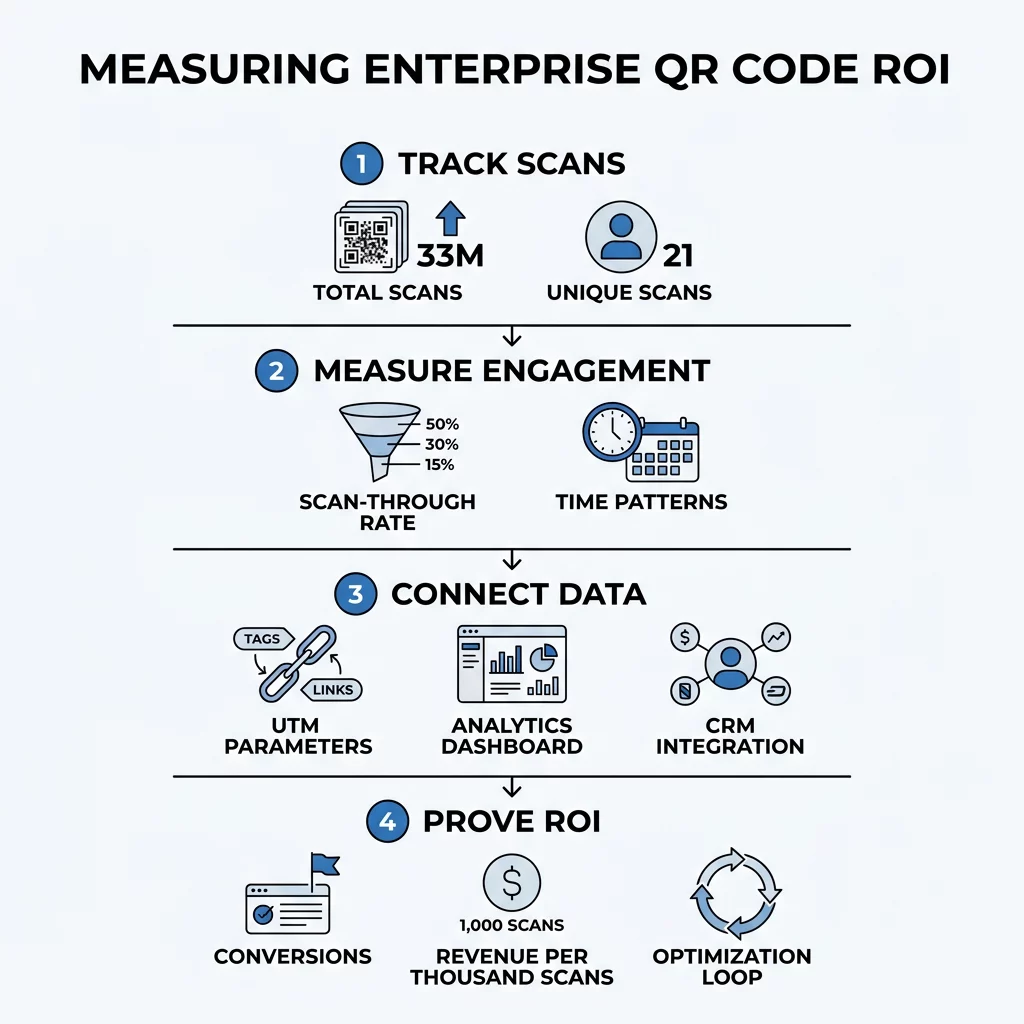
Strategic Integrations for Campaign Attribution
For your data to be useful, it must flow seamlessly into your existing marketing stack. Standardizing your tracking via UTM parameters is the most effective way to see QR code traffic within platforms like Google Analytics 4 or Adobe Analytics. By appending specific source, medium, and campaign strings to your destination links, you can monitor post-scan behavior, such as bounce rates and time on page, directly alongside your digital ad spend.
Integrating these insights with your CRM or marketing automation platform, such as Salesforce or HubSpot, allows you to build comprehensive customer profiles. This is particularly vital for gathering first-party data, a benefit reported by 95% of businesses using these tools. When a scan triggers a specific event in your CRM, you can track the entire customer journey from the initial physical touchpoint to a finalized sale or lead qualification.
Optimize your conversion rates. Create a link QR code with built-in tracking parameters to see exactly how your offline audience interacts with your digital content.
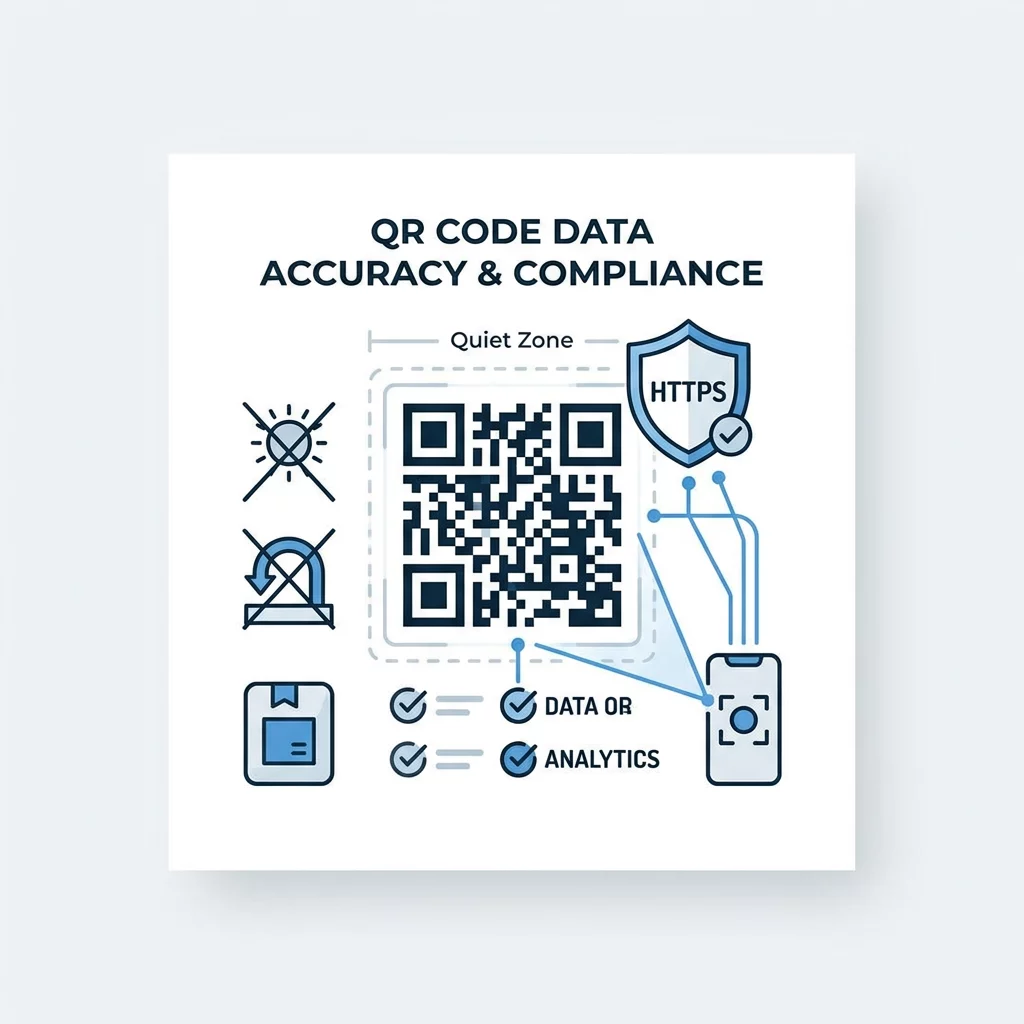
Ensuring Data Accuracy and Compliance
Scalable data quality depends on both technical precision and physical execution. To maintain high scan rates, you must adhere to established readability best practices, such as maintaining a proper distance-to-size ratio and ensuring the code is placed on a flat, non-reflective surface. Even the most advanced analytics dashboard is useless if the physical code fails to scan in the field.
Consistency in your data naming conventions is equally important. If different teams use varying UTM tags for the same campaign, your reporting will become fragmented and inaccurate. Beyond tracking, you must also prioritize secure QR code generation to maintain enterprise compliance. This includes using HTTPS encryption and password protection for sensitive data to ensure that both your company and your customers are protected from phishing or malware risks.
Finally, consider the visual accessibility of your codes. Scanners rely on distinct contrast to decode information accurately. Following color contrast guidelines by using dark patterns on light backgrounds ensures that your codes remain scannable across various lighting conditions. By combining these technical standards with robust analytics, enterprise teams can transform physical marketing from a cost center into a measurable driver of growth.
- Use high-resolution vector formats like SVG or EPS for printing to prevent blurriness.
- Maintain a clear quiet zone around the code to separate it from other design elements.
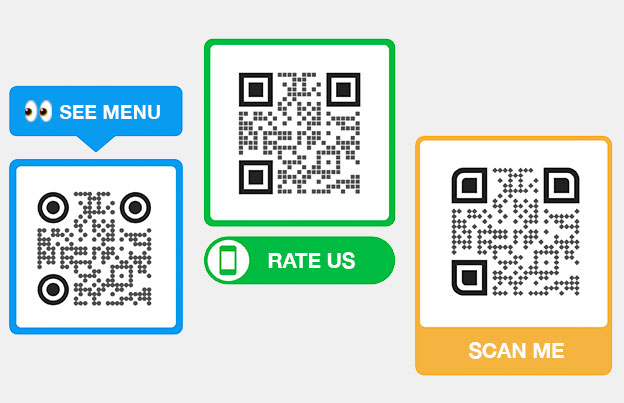
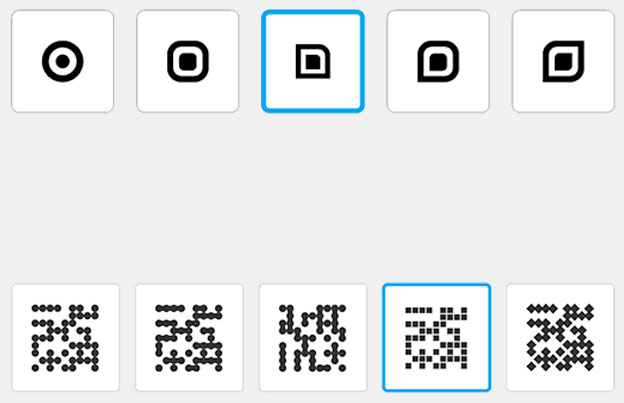
- Implement A/B testing on design variations to see which colors or frames drive higher ROI.
- Regularly audit physical placements to ensure codes have not been tampered with or obscured.
FAQ
Total scans represent every time the code is triggered, including multiple interactions by the same user. Unique scans use device-level identification to count individual people, providing a clearer picture of your actual audience reach.
Yes, by using dynamic codes embedded with UTM parameters, all scan data is funneled into your analytics platform. This allows you to track the user’s entire journey, from the initial scan to the final purchase or form submission.
Dynamic codes allow you to change the destination URL without reprinting physical assets and provide real-time data on location, time, and device type. Static codes are permanent and do not offer these tracking capabilities, making them unsuitable for measuring ROI. Ready to measure your campaign performance at scale? Explore how QR codes for software and enterprise management tools can streamline your marketing attribution today.


