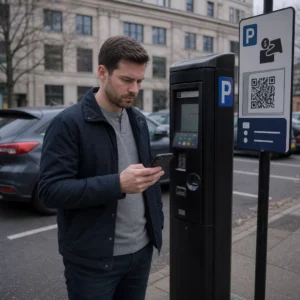
Are you struggling to determine which of your physical advertising locations actually drives the most digital traffic? Without regional data, marketing budgets are often wasted on underperforming areas while high-growth zones are ignored. This guide explains how to use dynamic QR codes and analytics to measure campaign performance by geographic region.
The Foundation of Regional Tracking
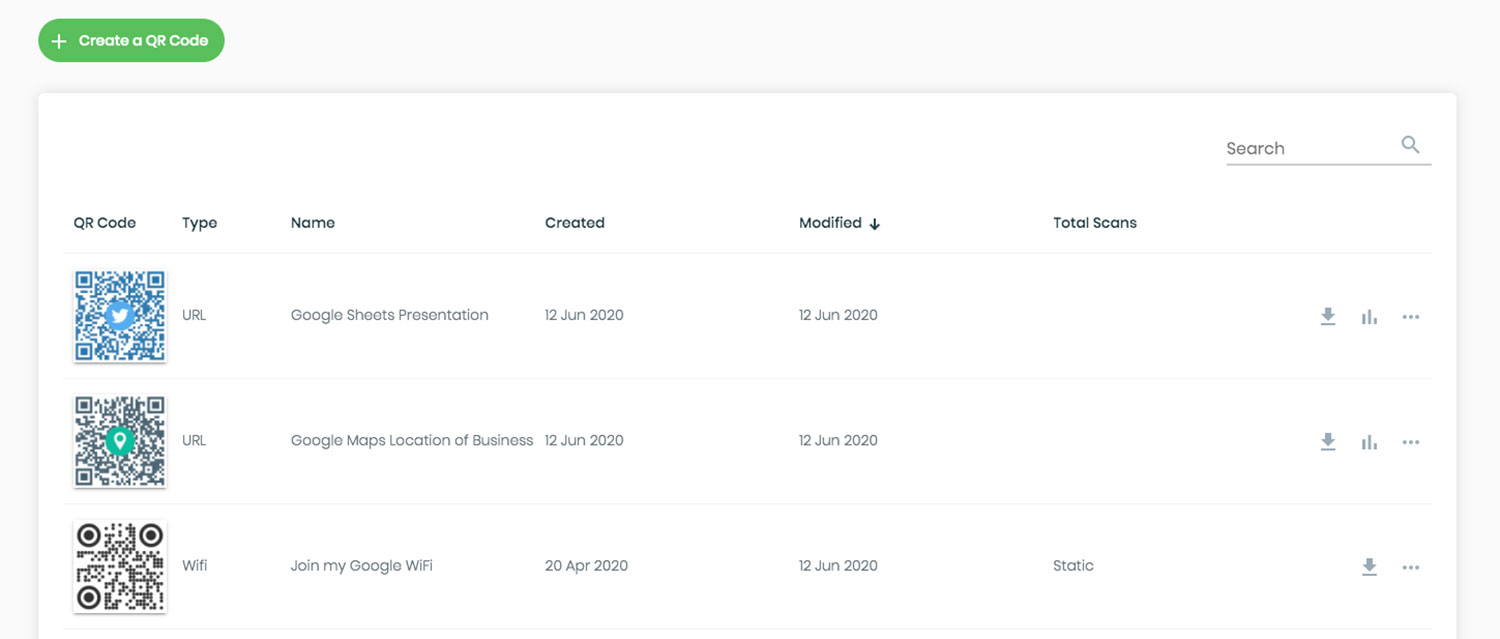
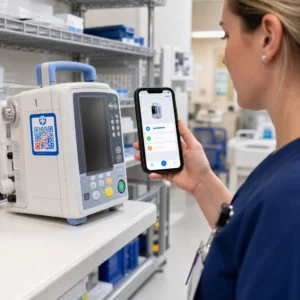
To effectively monitor where your scans are coming from, you must move beyond basic, unchangeable codes. While static QR codes are permanent and provide no data, dynamic QR codes act as a flexible bridge between your physical assets and digital insights. These codes use a short redirect URL to log scan details before sending the user to the final destination.
This redirect process allows you to update the destination URL at any time without reprinting your materials. If a regional offer changes or a link breaks, you can fix it instantly in your dashboard. Beyond flexibility, these codes are the only way to access real-time tracking for geographic analysis, capturing the specific city, state, or country of every interaction.
How Geolocation Analytics Work
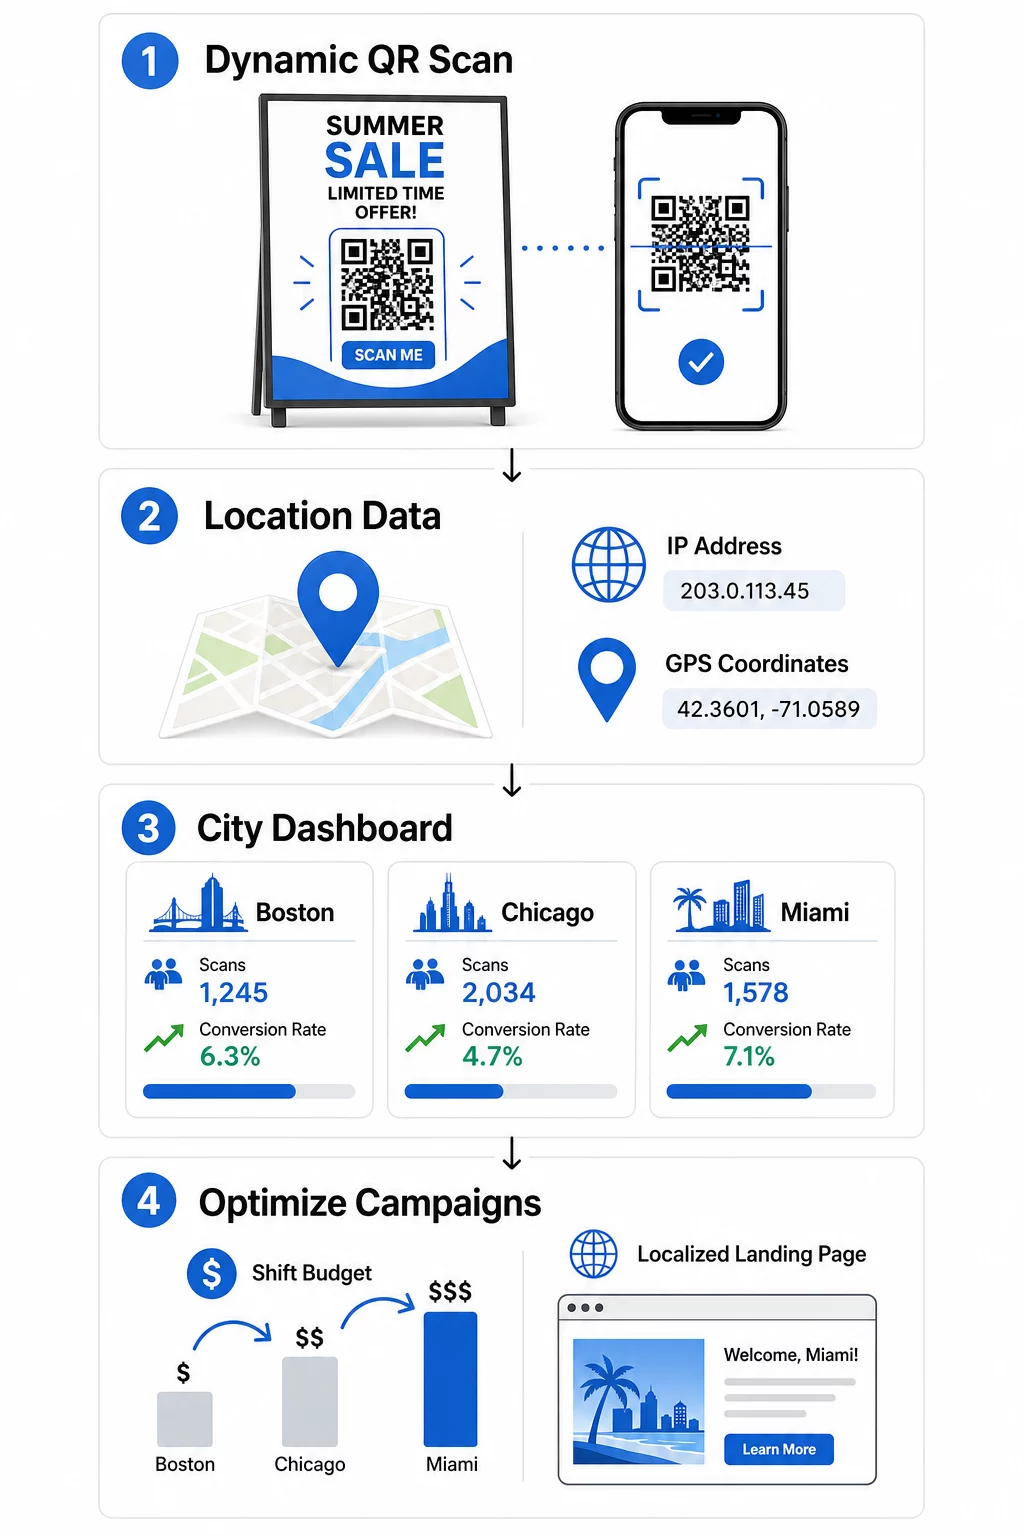
When a user scans a dynamic code, the platform identifies their location using one of two primary methods. Understanding the difference helps you choose the right approach for your campaign goals.
- IP-Based Tracking: This is the most common method as it works automatically without requiring user consent. It provides city-level accuracy of approximately 50–70%, making it ideal for broad regional analysis and identifying high-traffic urban areas.
- GPS-Based Tracking: For precise location data, GPS tracking can identify a scan’s location within a few meters. However, this requires the user to explicitly grant permission on their device. If permission is denied, the system typically falls back to a default page or IP-based data.
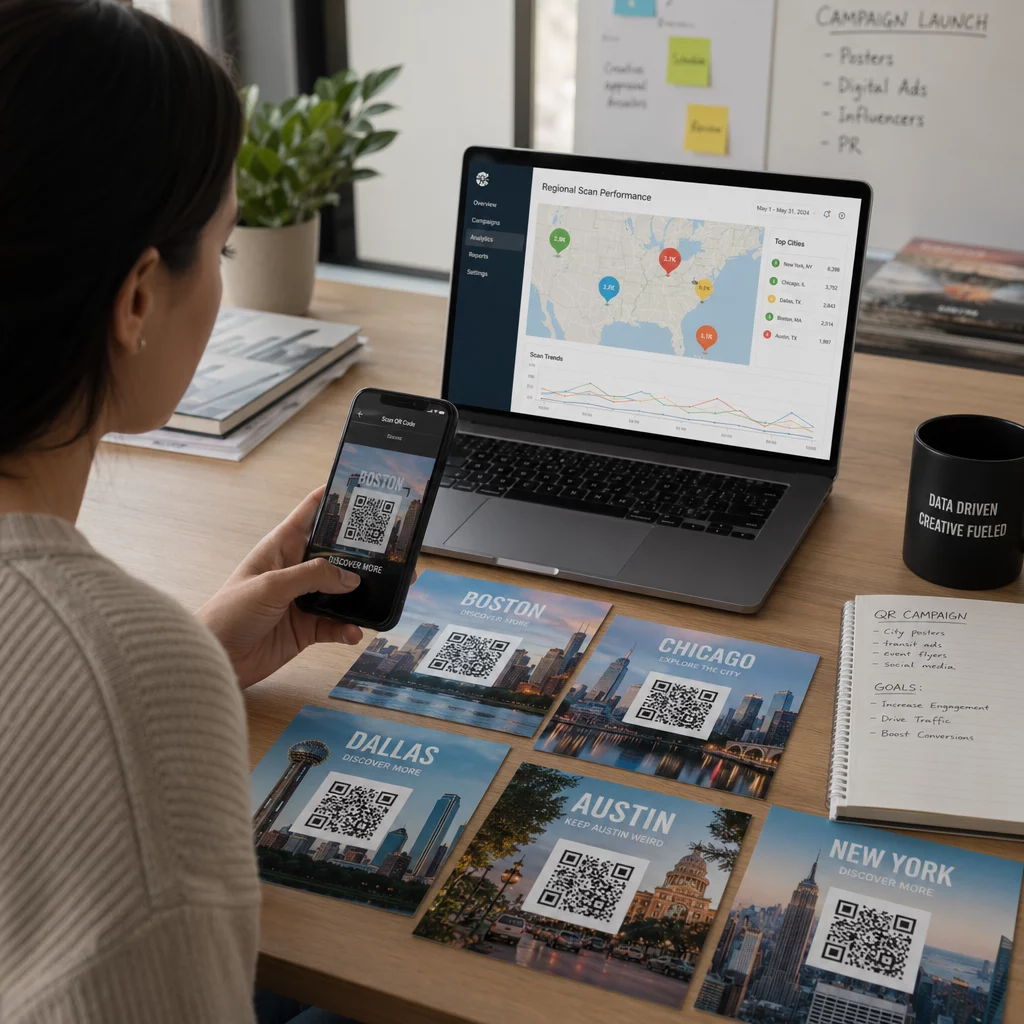
Using geolocation analytics for QR codes allows you to visualize engagement through heatmaps. These visual tools show exactly where scans are concentrated, helping you identify regional trends that might otherwise stay hidden in a spreadsheet.
Monitor Your Campaign in Real-Time Want to see exactly where and when your customers are scanning your materials? Use the Dynamic QR Code Generator to create trackable codes and access a full performance dashboard today.
Setting Up UTM Parameters for Regional Insights
To distinguish between scans from different cities in your primary analytics tools, you should use UTM parameters. These are small tags added to the end of your URL that tell platforms like Google Analytics exactly where the traffic originated.
For a multi-city campaign, you might create a unique QR code for each location. For example, a poster in Boston could use a source tag like “bostonflagship,” while a flyer in Chicago uses “chicagoevent.” By maintaining consistent naming conventions, you can filter your traffic in GA4 to see how users from specific regions behave once they reach your website. This method of tracking QR codes ensures that offline marketing efforts are just as measurable as your digital ads.
Best Practices for Regional UTMs
- Use descriptive source values like “nycstorefront” or “seattlebus_stop.”
- Keep the medium tag consistent, such as “qr_code,” to group all scans together.
- Utilize the campaign tag to track specific initiatives across all regions.
- Document your parameters in a shared style guide to prevent data fragmentation.
Integrating UTM parameters for QR codes allows you to track the entire customer journey from the physical scan to a final purchase or signup.
Analyzing Regional Data through Dashboards
A centralized QR code analytics dashboard simplifies the process of comparing regional performance. Instead of manually sorting data, you can view real-time metrics that highlight which areas are meeting their goals.
Key Metrics to Monitor
- Total vs. Unique Scans: Total scans show overall activity, while unique scans tell you how many individual people interacted with the code.
- Scan Timing: Identifying peak scan hours by region helps you optimize staffing or flash sales.
- Device and OS Data: Understanding if your regional audience prefers iOS or Android ensures your landing pages are technically optimized for them.
- Conversion Rate: This reveals which regions actually take action after scanning, rather than just browsing.
Comparing these metrics for location-based campaigns often reveals surprising results. For instance, a smaller city might have fewer total scans but a significantly higher conversion rate than a larger metro area, indicating a more engaged or relevant audience.
| Region | Total Scans | Unique Scans | Peak Engagement Time | Conversion Rate |
|---|---|---|---|---|
| Boston | 1,240 | 890 | 12:00 PM – 2:00 PM | 12.5% |
| Chicago | 980 | 720 | 5:00 PM – 7:00 PM | 8.3% |
| Miami | 1,560 | 1,120 | 6:00 PM – 8:00 PM | 15.2% |
Optimizing Campaigns Based on Regional Data
Once the data identifies high- and low-performing zones, you can take action to improve ROI. If three specific cities drive 40% of your scans, you might reallocate your budget to those areas to maximize impact.
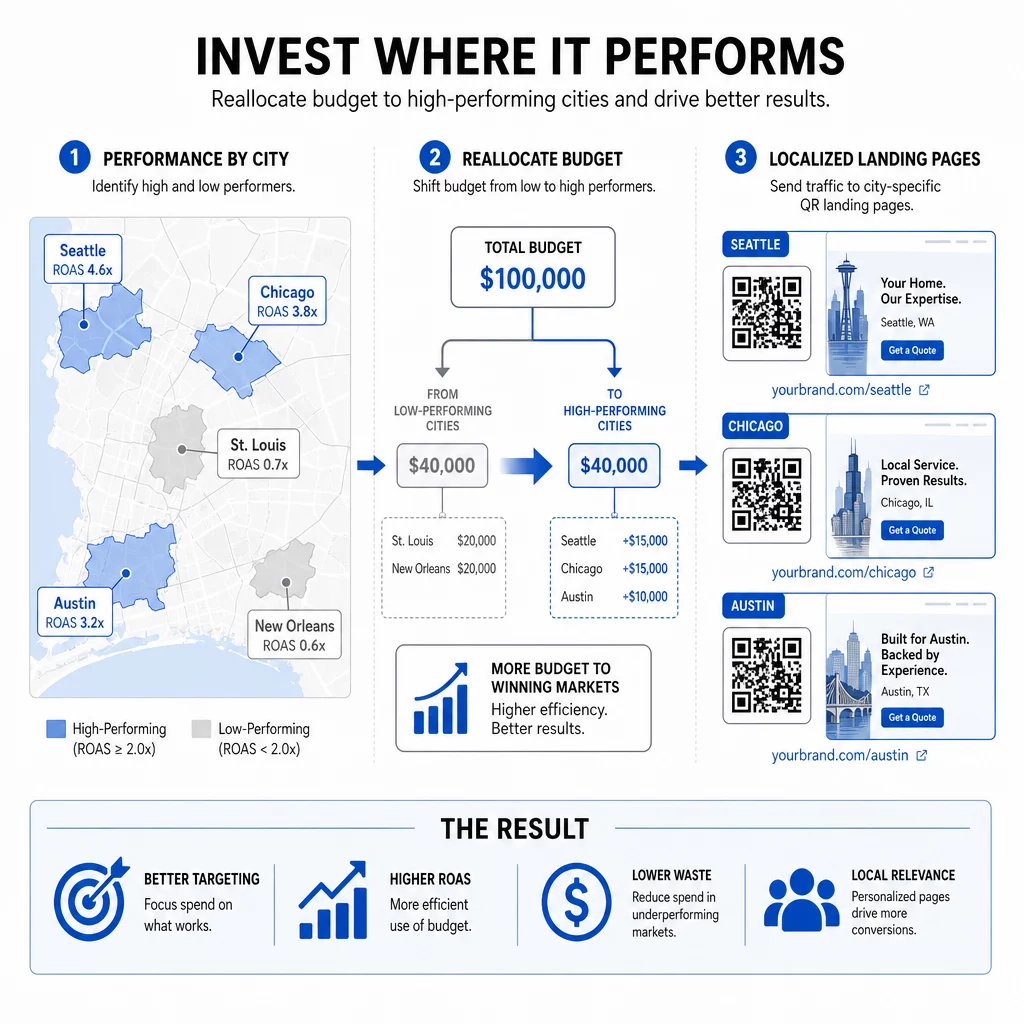
Geotargeted QR codes also allow for personalized experiences. You can direct users to regional landing pages that feature local store hours, inventory, or city-specific greetings. Brands that prioritize personalization often see higher engagement, as roughly 39% of users now expect customized interactions when scanning.
For regions with low engagement, consider experimenting with different physical placements or call-to-action phrases. You might also use geofencing for QR campaigns to set virtual boundaries that trigger specific content only when a user is within a certain distance of your store.
Frequently Asked Questions
You can track general locations like city and country using IP addresses automatically. To get precise GPS coordinates, the user must explicitly give permission on their smartphone after scanning.
No, as long as you are using dynamic QR codes. You can update the destination URL and UTM parameters in your management dashboard without ever changing the physical printed code.
Yes, provided you follow best practices. IP-based tracking is generally acceptable for regional analysis, but GPS-based tracking requires explicit user consent. Always use a trusted provider that prioritizes data encryption and anonymization.
Regional QR code tracking transforms a simple scan into a wealth of geographic intelligence. By moving to dynamic codes and utilizing detailed analytics dashboards, you can stop guessing which locations are working and start making data-driven decisions that grow your business. Ready to see where your customers are? Start by creating your first trackable campaign today.


