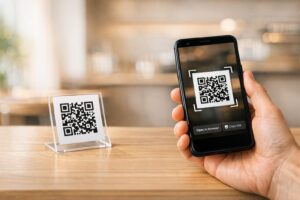
Have you ever scanned a QR code only to be met with a broken link or a page that won’t load? This technical failure often causes users to lose trust in your brand and abandon the interaction entirely. By following a structured testing process for scan reliability and post-scan experience, you can ensure a seamless mobile journey for every customer.
Establishing Scan Reliability Through Size and Distance
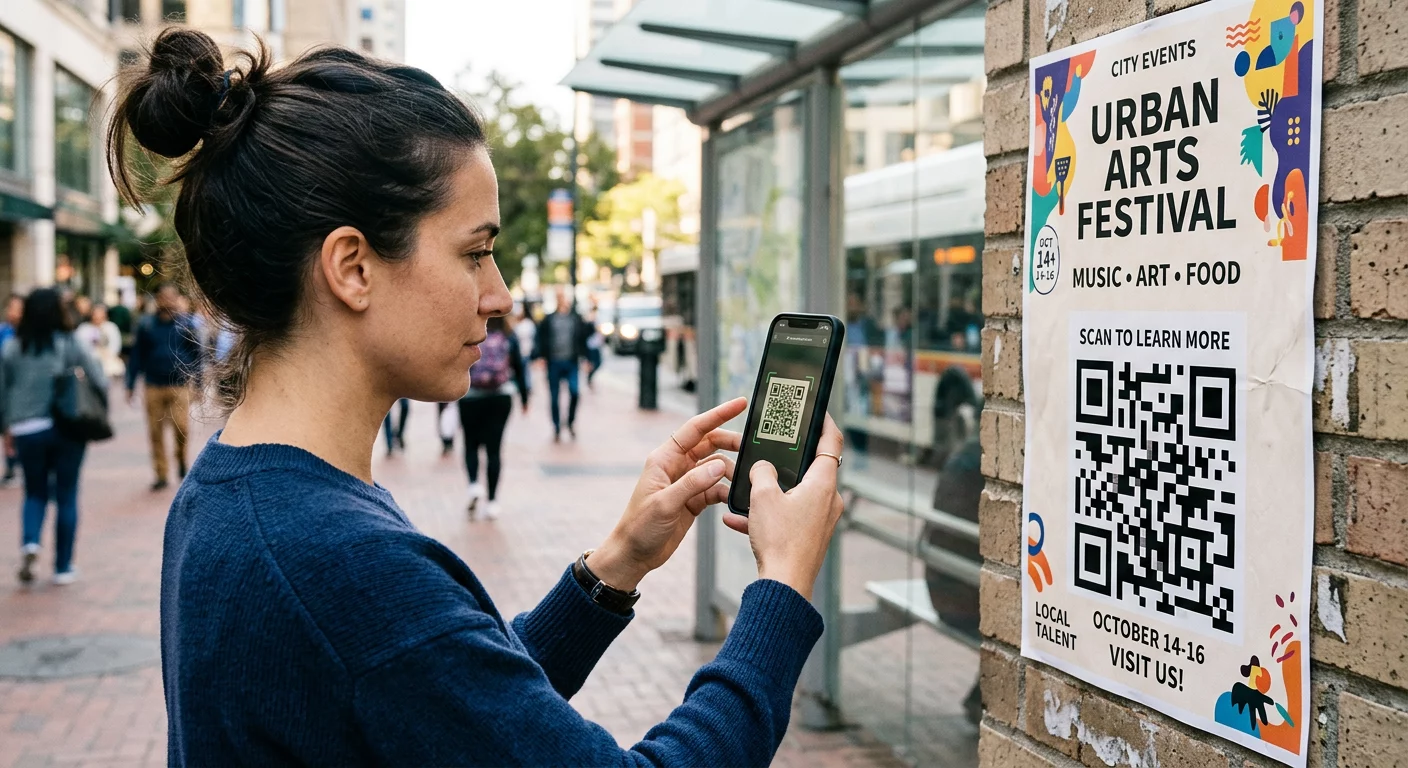
A QR code that fails to scan creates an immediate barrier between your physical touchpoint and your digital content. Reliability begins with the relationship between the physical size of the code and the distance from which a user scans it. To maintain high success rates, you should follow the 10:1 size-to-distance ratio, where the code width is approximately one-tenth of the scanning distance. For example, if you expect a customer to scan a poster from 20 inches away, the code should be at least 2 inches wide.
Even for close-range items like business cards, you should avoid making codes too small. The minimum reliable size for a printed QR code is generally 0.8 x 0.8 inches (2 x 2 cm). Smaller codes often fail on older smartphones or budget Android devices with lower-resolution cameras that struggle to focus on dense patterns. When your code contains complex data, such as a long URL, the pattern becomes denser, requiring an even larger physical footprint to remain readable.
Why Contrast and Quiet Zones Define Scannability
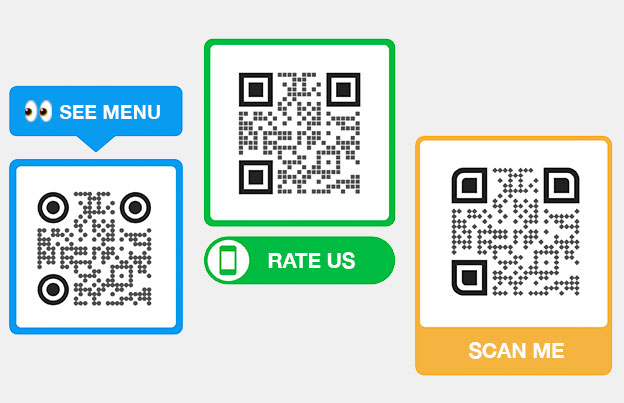
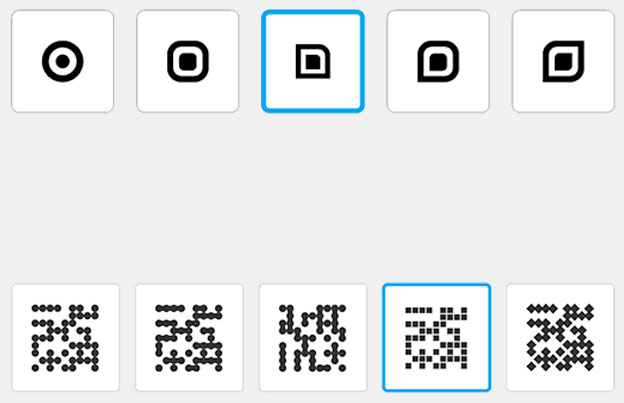
Visual design serves as a technical blueprint for the smartphone’s camera sensor. Scanners require high contrast to distinguish the dark data modules from the light background. Think of the scanner like a high-speed reader that needs clear edges to interpret the data; if the colors are too similar, the “reading” process fails. You should aim for a contrast ratio of at least 4.5:1 for small codes. While custom brand colors can increase engagement, maintaining QR code color contrast best practices by using dark foregrounds on light backgrounds remains the most reliable approach.
The area surrounding the code, known as the “quiet zone,” is equally critical for usability. This is a blank margin – ideally four modules wide – that separates the QR code from surrounding text, images, or frame edges. Without this buffer, the scanner may incorporate nearby graphic elements into the code pattern, resulting in a decoding error.
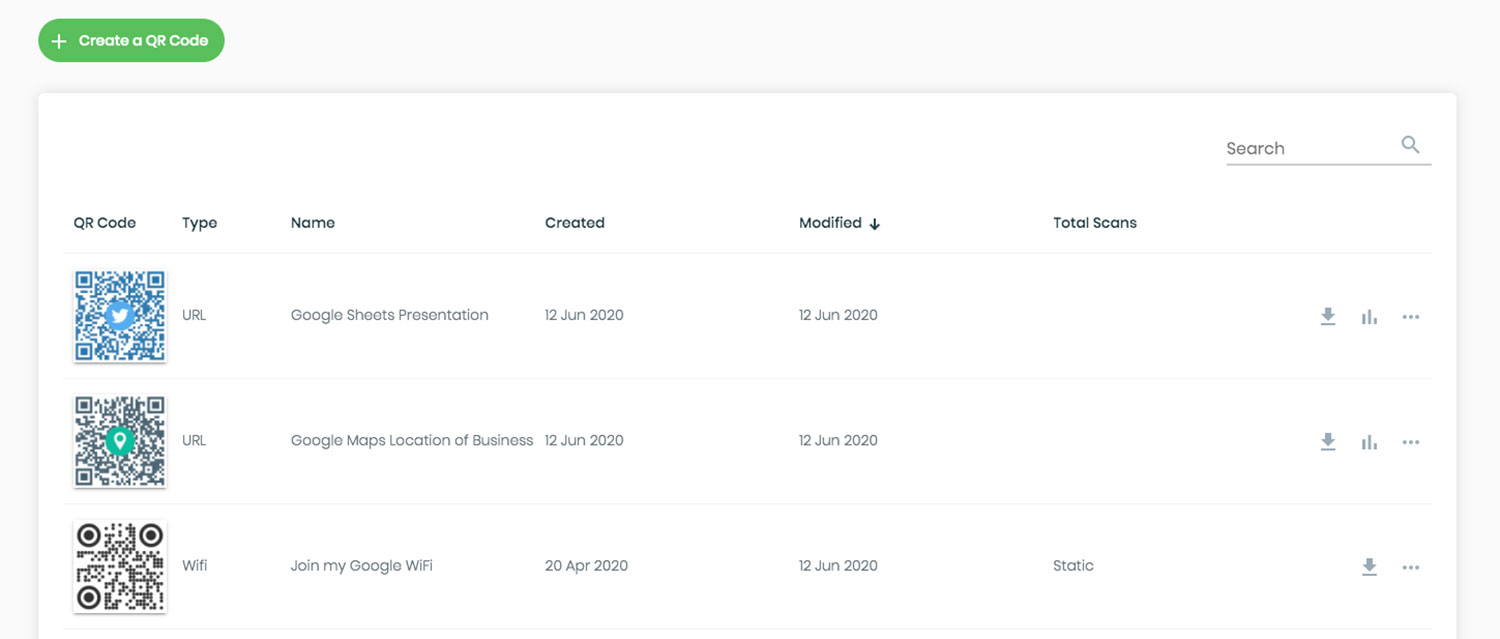
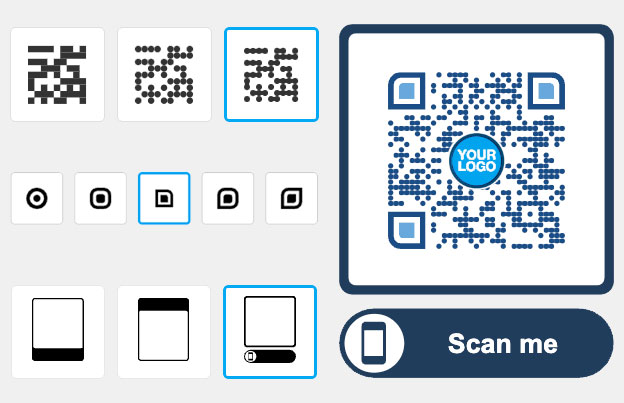
Before finalizing your design, use a professional QR code generator to customize your branding while receiving real-time feedback on scannability and technical requirements.
Testing Performance Across Different Mobile Devices
Your QR code might scan perfectly on a flagship iPhone in a well-lit office, but real-world conditions are rarely ideal. A robust testing matrix must account for variations in hardware and environment. While modern iPhones feature highly consistent native camera integration, Android performance varies significantly across different manufacturers and models. Budget devices often have slower autofocus and struggle with glare or low-light conditions.
To ensure universal accessibility, you should test your codes in several scenarios:
- Scan the code under direct, harsh lighting to check for reflections and glare, especially on glossy materials.
- Test scannability in low-light environments, such as a dimly lit restaurant or a transit station.
- Verify the code on curved surfaces, like bottles or cans, ensuring the pattern does not wrap so far that the scanner cannot see the entire square at once.
- Print a physical mockup on the intended material to verify best practices for QR code readability before proceeding with a full print run.
Evaluating the Post-Scan Mobile Landing Page
The scan is merely the gateway to the actual user experience. If the destination page is not optimized for mobile, the initial scan becomes a wasted effort. Statistics indicate that 53% of mobile users will abandon a site if it takes longer than three seconds to load. Speed is the most important factor in the post-scan journey, as users scanning in public spaces often have limited time or inconsistent cellular data.
A truly usable mobile QR code landing page must be designed for touch. This means interactive elements should have tap targets at least 48px wide to accommodate thumb navigation. You should also ensure that your body text is at least 16px to maintain readability on small screens without requiring the user to zoom. Minimizing redirects and compressing heavy images are essential steps to achieving the fast load times necessary for high conversion rates.
Improving Campaign Flexibility with Dynamic Codes
Using static QR codes for marketing is a significant risk because the data is hard-coded into the pattern. If a URL changes or a typo is discovered after printing, the code becomes a permanent dead end. You can mitigate this risk by using a dynamic QR code generator. These codes point to a short redirect URL, allowing you to update the destination link at any time without changing the printed code.
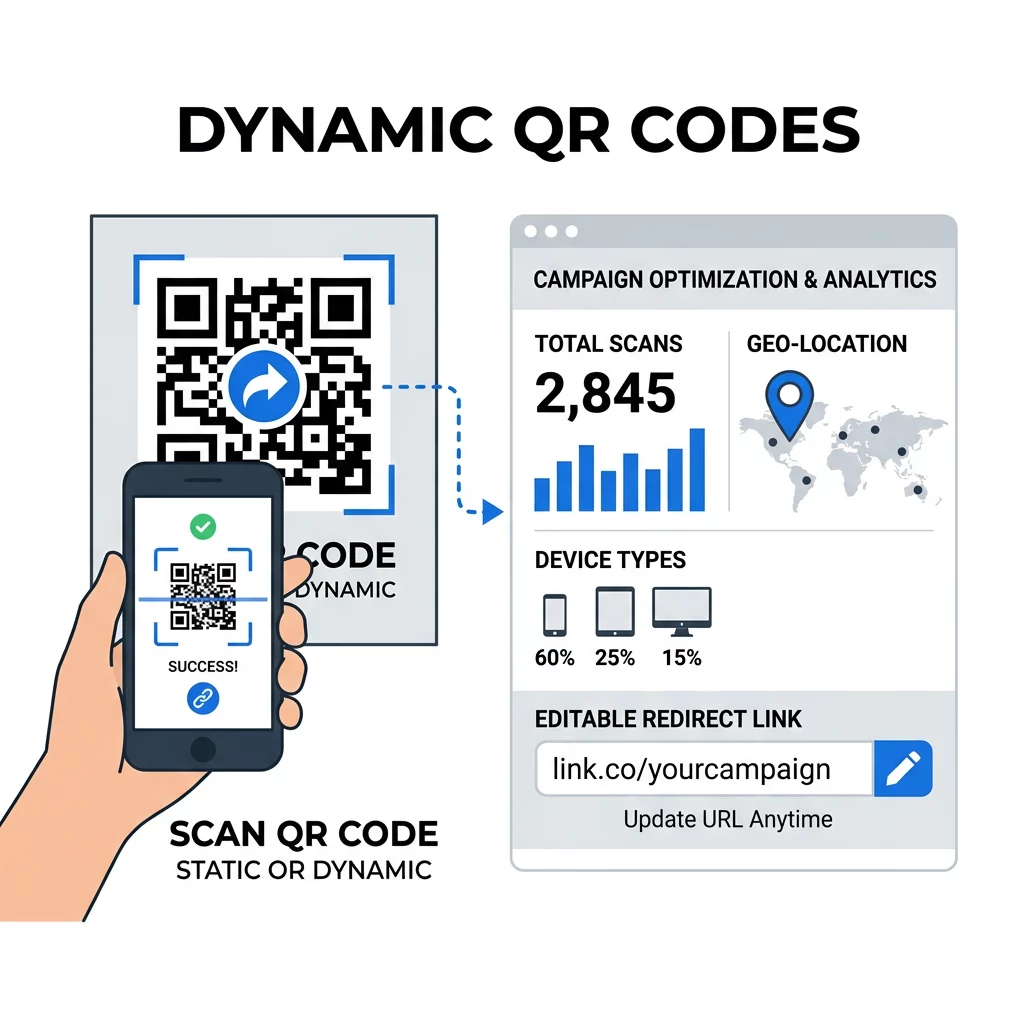
Beyond editability, dynamic technology provides the analytics necessary to validate your usability testing. You can track scan counts, geographic locations, and the types of devices used by your audience. This data allows you to see if users on specific operating systems are struggling to engage, enabling you to optimize your campaign in real-time.
To learn more about how these choices affect your long-term marketing strategy, compare the benefits of static vs dynamic QR codes to find the right fit for your business needs.
Frequently Asked Questions
For print materials, the practical minimum is 0.8 x 0.8 inches (2 x 2 cm). If the code is displayed on a digital screen, it should be at least 240 x 240 pixels to ensure that smartphone cameras can resolve the individual modules clearly.
This inconsistency is usually caused by poor color contrast or low image resolution. iPhones often have more advanced image processing that compensates for design flaws, whereas many Android devices require a sharp, high-contrast image (ideally a 4.5:1 ratio) to successfully decode the pattern.
Error correction allows a code to remain scannable even if it is partially damaged or obscured by a logo. While Level L recovers 7% of data, Level H can recover up to 30%. Using a higher level like Q or H improves reliability in harsh environments, though it makes the code pattern denser. By implementing these testing protocols – from verifying the 10:1 scanning ratio to optimizing landing page load speeds – you can turn QR codes into a reliable bridge between your physical assets and digital results. To begin creating and testing your own high-performance codes, explore the tools available through the Pageloot platform.


