
Are you unsure if your QR code design is actually driving scans or just taking up space? Without data-driven testing, your physical marketing remains a black box that might be wasting your budget. This guide provides a systematic framework for A/B testing QR codes to maximize your engagement and conversion rates.
Why A/B Testing is Essential for QR Marketing
A/B testing, or split testing, compares two versions of a QR code to determine which configuration drives the most action. In the offline-to-online world, small tweaks often lead to massive results. For example, Flipkart boosted scan-through rates by 15% during their Big Billion Days campaign simply by making mid-campaign adjustments based on performance data. Similarly, branded QR codes can attract up to 80% more scans than standard black-and-white versions, proving that aesthetics directly impact user trust and participation.
By testing different elements, you move away from guesswork and toward data-backed decisions. This process identifies which call-to-action (CTA) resonates with your audience and which placement gets the most visibility. Case studies show that the stakes are high; HSBC UK partnered with Shelter and saw a 52% increase in accounts within two weeks by optimizing their reach. Testing allows you to replicate these successes by isolating what truly motivates a user to scan.
High-Impact Variables to Test
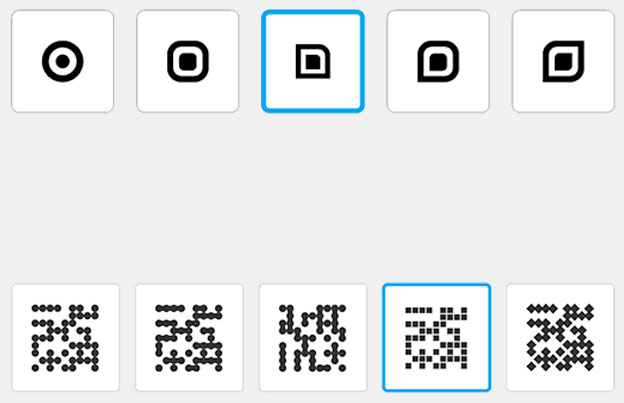
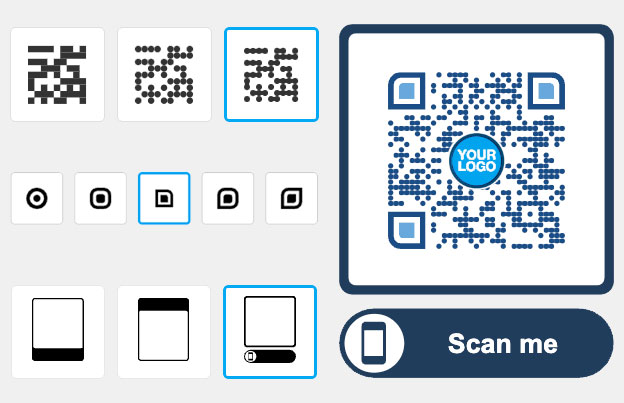
To run a successful experiment, you must isolate one variable at a time. If you change the design and the physical location simultaneously, you will not know which change caused the performance shift. Visual design and contrast serve as the foundation of scannability. You might test a standard code against a QR code with a logo to see if branding increases scan rates. It is critical to maintain a foreground that is at least 40% darker than the background, as poor contrast is a primary cause of failed scans in dim environments.
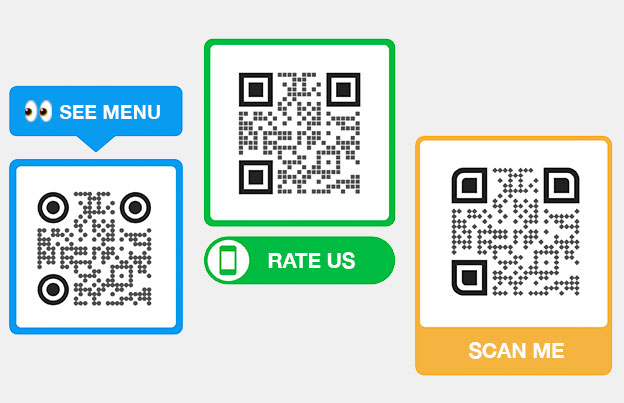
The Call-to-Action (CTA) text is another high-impact variable. Generic phrases like “Scan Me” often underperform when compared to value-driven CTAs like “Scan for 20% Off” or “Find your skincare match.” Research indicates that specific, action-oriented text can improve conversions by 4% or more. Think of the CTA as the “hook” that bridges the gap between the physical material and the digital experience.
Beyond design, the size and placement of the code dictate its accessibility. You should test different locations, such as eye-level posters versus checkout-counter displays, to find where your audience is most likely to engage. Always follow the 10:1 distance-to-size ratio; if a user is scanning from 10 inches away, the code should be at least 1 inch wide. Finally, if your scan rate is high but users are leaving immediately, you may need to test your mobile-friendly landing page to ensure it loads quickly and provides immediate value.
Optimize your testing strategy: Use our Dynamic QR Code Generator to create trackable versions that allow you to update destinations and designs without reprinting your materials.
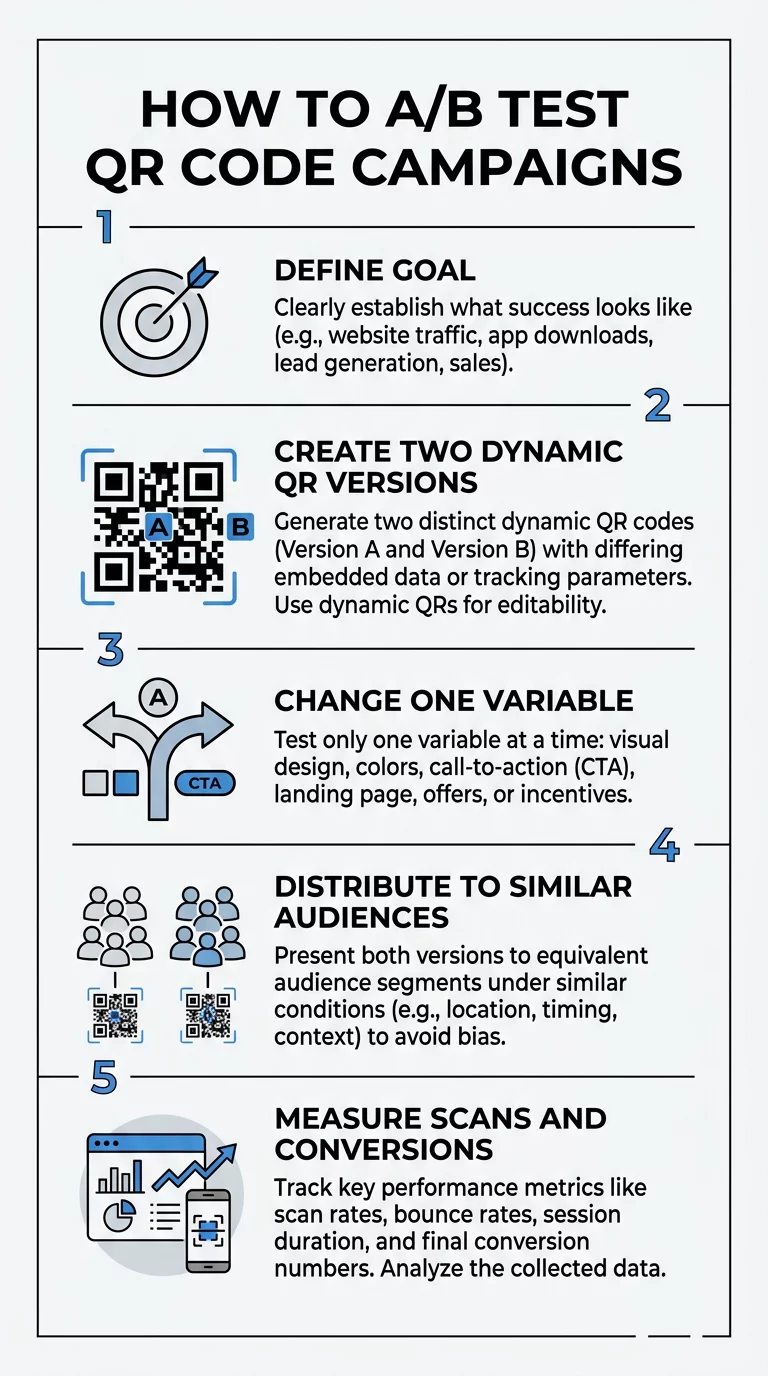
Step-by-Step Framework for QR A/B Testing
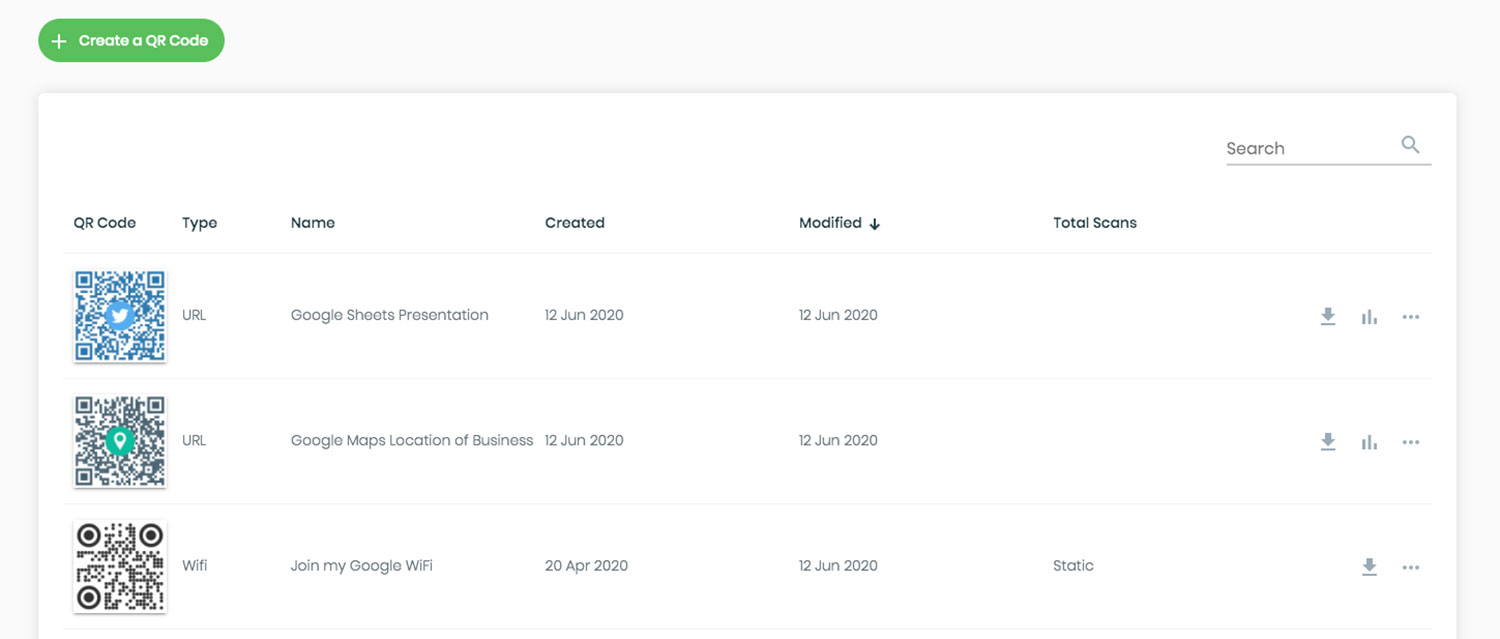
Setting up a reliable experiment requires dynamic QR codes. Unlike static codes, dynamic versions allow you to track scan data in real-time and edit the destination URL even after the material is printed. This flexibility is essential for mid-campaign corrections and iterative testing.
The first step is to define a measurable goal, such as increasing total scans or driving a specific action like a PDF download. Once the goal is set, generate two unique dynamic QR codes, keeping every element identical except for the single variable you are testing. For example, Version A could feature a blue frame while Version B uses a red one. To track what happens after the scan, integrate UTM parameters into your destination URLs. This enables Google Analytics to differentiate between the traffic coming from each version accurately.
When you are ready to distribute your materials, ensure you use comparable test groups. This means placing the variations in similar environments at the same time to avoid bias caused by weather, local events, or day-of-week trends. Monitor the results for at least one to two weeks, or until you reach a 95% statistical significance level, to ensure the outcome is not a result of random chance.
Measuring and Analyzing Your Results
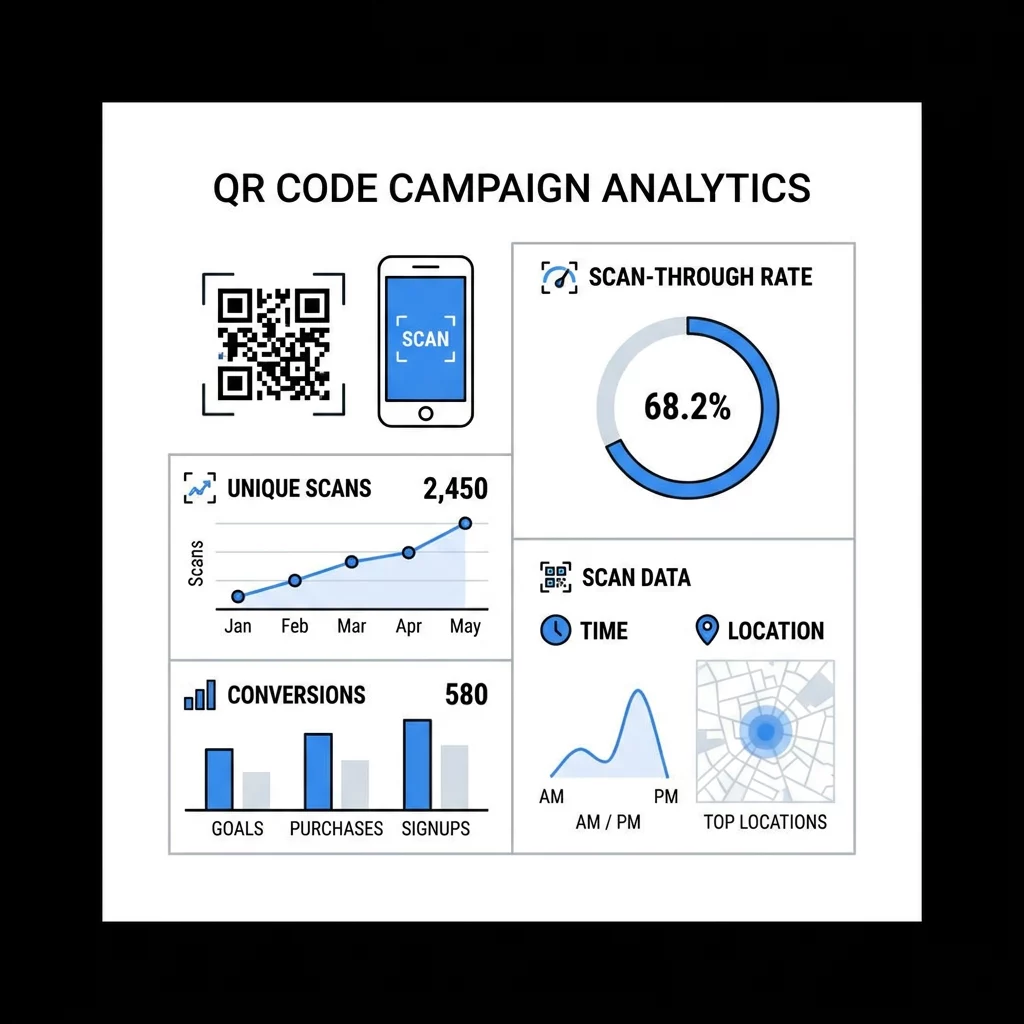
Once your test duration is complete, dive into your QR code analytics to crown a winner. Analyzing the data requires a focus on both the quantity of interactions and the quality of the resulting traffic. Unique scans are particularly important because they filter out repeat users and provide a clearer picture of your actual reach.
| Metric | Why it Matters |
|---|---|
| Unique Scans | Measures individual reach and filters out repeat interactions. |
| Scan-Through Rate (STR) | Shows the percentage of people who saw the code and chose to scan it. |
| Conversion Rate | Tracks the percentage of scanners who completed the final goal (e.g., a purchase). |
| Time and Location | Identifies peak engagement hours and high-performing geographic hotspots. |
By optimizing QR code performance through these metrics, you can refine your strategy. While the average landing page conversion rate is roughly 2.35%, top-performing campaigns that utilize consistent A/B testing can reach 11% or higher. Use these benchmarks to determine if your variants are meeting industry standards or if further iteration is required.
Take control of your data: Monitor every scan, location, and device type in real-time with our QR code tracking tools.
Common Pitfalls in QR Code Testing
Several common mistakes can invalidate your testing data and lead to incorrect conclusions. Testing multiple variables at once – such as changing the color, the logo, and the CTA simultaneously – makes it impossible to determine which specific change caused the shift in performance. Furthermore, using an insufficient sample size can lead to misleading results; you should aim for hundreds of scans before making permanent changes to your campaign.
Another major hurdle is poor mobile optimization. Since 59% of consumers scan QR codes daily on mobile devices, a landing page that is slow or difficult to navigate will destroy your conversion rate, regardless of how attractive the QR code is. Finally, ensure you are using a 4:1 contrast ratio at minimum to prevent technical scanning failures that could skew your data toward versions that are simply easier for a camera to “read” rather than versions that are more appealing to humans.
Continuous iteration is the secret to high-performing campaigns. By treating every QR code as an experiment, you can systematically remove friction from the customer journey and turn offline touchpoints into measurable digital growth.
FAQ
Dynamic QR codes are essential because they provide real-time analytics and allow you to change the destination URL or design without reprinting. Static codes offer no tracking and cannot be updated once printed, making them unsuitable for iterative testing.
Most campaigns require two to six weeks to gather enough data to be representative. The exact duration depends on your scan volume; you should continue the test until you have gathered enough scans to reach a 95% statistical significance level.
While rates vary by industry, the average QR code scan-through rate is approximately 12.8%, which often outperforms many digital display ads. For high-engagement materials such as restaurant menus or event badges, these rates can climb as high as 60–75%.


