
Are you running AR-enabled QR code campaigns at events but struggling to tell what’s actually working? Without the right metrics in place, scan data sits unused while engagement opportunities slip by. This guide walks you through which metrics matter, how to read them, and how to turn that data into better event outcomes.
What Makes AR QR Code Tracking Different
Traditional QR codes tell you how many people scanned a code and, broadly, where they were when they did it. AR-enabled QR codes go further. Because the experience unfolds inside the scan itself – through 3D models, video overlays, spatial elements – there are more meaningful moments to measure.
The core difference is that AR QR codes require tracking both initial engagement (the scan) and immersive interaction (dwell time, 3D object interactions, spatial movement). A standard scan count only tells you someone started the experience. Dwell time, interaction depth, and post-scan behavior tell you whether it resonated.
On average, WebAR campaigns see dwell times between 60 to 120 seconds – far longer than the brief interactions typical of standard QR codes. That extended engagement window creates a richer data trail, but only if you know what to capture.
The Core Metrics to Track
Before setting up any tracking infrastructure, establish what success looks like for your specific event. A brand awareness activation has different KPIs than a lead generation booth. Once your objectives are clear, every metric has a defined role.
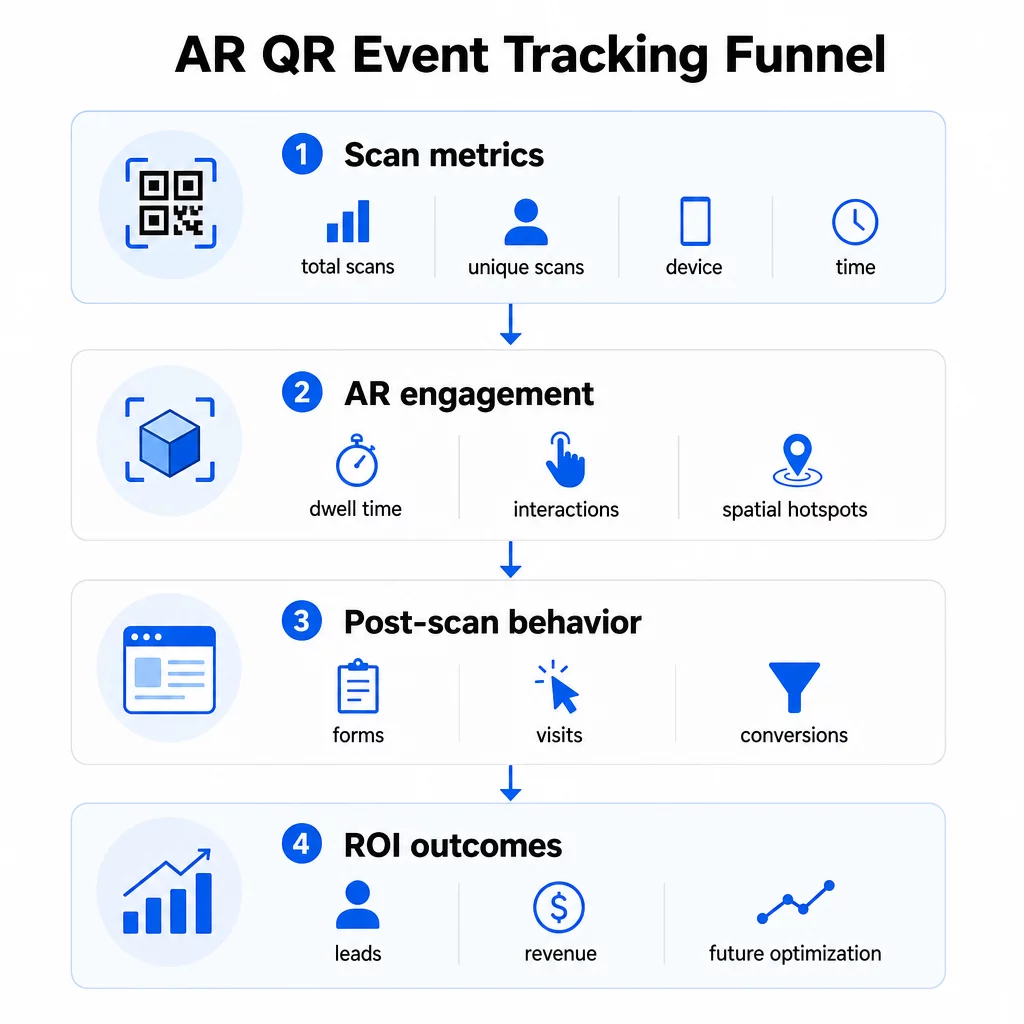
Scan-level metrics form the foundation:
- Total scans – overall reach and engagement volume
- Unique scans – approximate number of individual attendees who interacted
- Scan frequency (total ÷ unique) – whether people are returning to the experience, which signals genuine interest
- Time and date of scan – peak engagement windows help you identify which sessions, booths, or time slots drove the most activity
- Device and OS data – knowing whether your audience is predominantly on iOS or Android lets you optimize the landing page and AR experience for the dominant device type
- Geolocation data – city or region-level scan data reveals where engagement is highest, useful for multi-venue events or future event placement decisions
AR-specific metrics go deeper:
- Dwell time – how long users stay inside the AR experience, not just on the landing page
- Spatial analytics – which physical areas of your venue or booth generated the most scan activity
- 3D interaction events – whether users rotated a product model, triggered a video, or completed an interactive element
Post-scan behavior closes the loop:
- Form submissions, registrations, or downloads that followed the scan
- Bounce rate and time-on-page for the landing page destination
- Conversions tied to specific campaign goals (ticket purchases, newsletter sign-ups, demo requests)
For B2B events in particular, the most valuable metrics are new quality leads generated, new accounts engaged, and eventual revenue attributed to the event. Scan data feeds the top of that funnel, but post-scan conversions determine ROI.
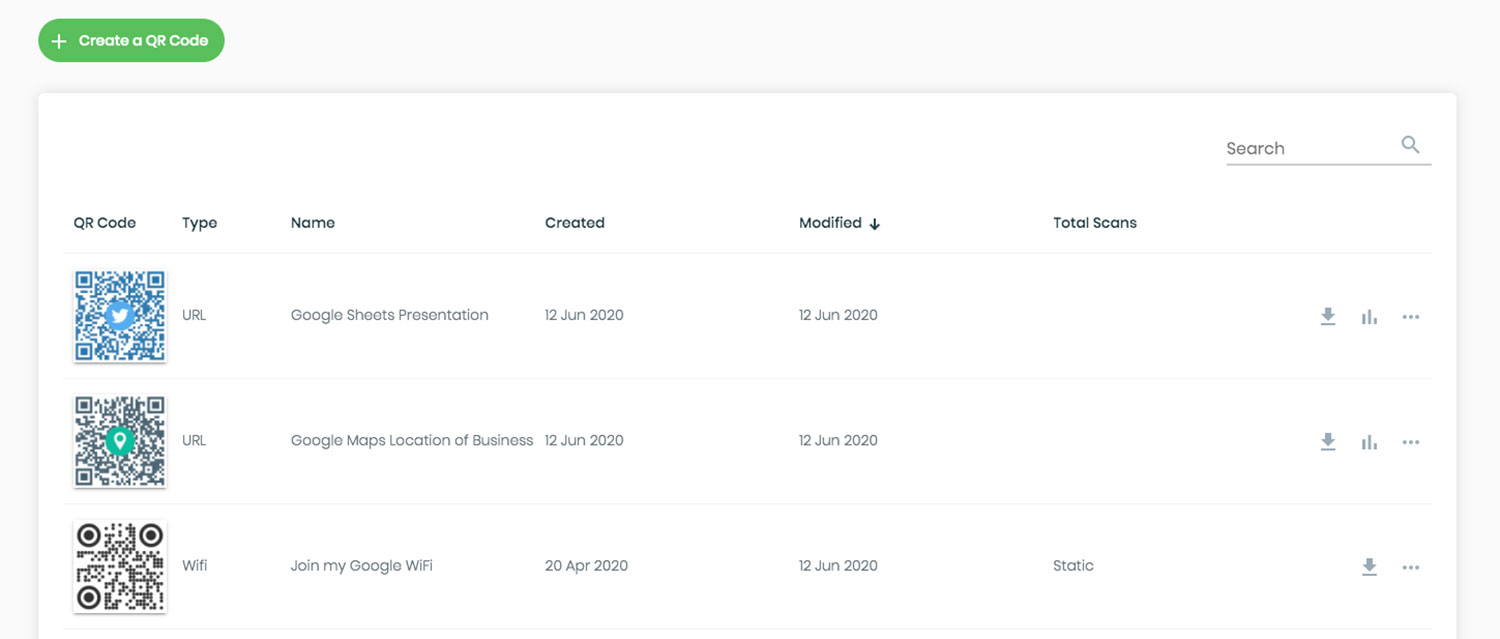
すべてのスキャンをリアルタイムで追跡 を使用しています。 Pageloot Analytics dashboard to monitor total scans, unique scans, device types, and scan locations as they happen during your event – no technical setup required.
Setting Up Your Tracking Infrastructure
Getting accurate data requires a few decisions before your event goes live.
動的QRコードを使用する
Static QR codes encode a fixed destination and provide no tracking. Dynamic QR codes route scans through a redirect, which is where scan metadata – time, device, location – gets logged. The ダイナミックQRコードジェネレーター from Pageloot creates codes that track scan rates, location data, and other metrics automatically, and lets you update the destination URL without reprinting materials. For multi-day events where schedules or calls-to-action may change, this flexibility is essential.
Add UTM Parameters for Post-Scan Tracking
Attaching UTM parameters to your QR code destination URLs allows tools like Google Analytics 4 to distinguish QR-driven traffic from other sources and measure what happens after the scan. A well-structured URL looks like:
`https://yoursite.com/event-page?utmsource=eventbooth&utm媒体=qrcode&utmcampaign=conference2025`
Using descriptive `utmsource` values (e.g., `mainstagebooth`, `registrationdesk`) lets you compare performance across different placement locations at the same event. Keep naming conventions consistent – lowercase, underscores instead of spaces – so your GA4 reports stay clean and filterable. The guide on QRコード用のUTMパラメータ covers this setup in detail.
Connect Your Attendance Data
If you’re using QR codes for event check-ins, your attendance data and your engagement data can be read together. The attendance QR code system logs arrivals in real time, which lets you cross-reference who checked in against who scanned your AR experience and completed a post-scan action. This is particularly useful for calculating true conversion rates rather than just scan-to-landing-page rates.
For collecting structured responses – feedback, registrations, post-event surveys – pair your QR codes with Google Forms using the GoogleフォームQRコードジェネレーター. Form submission data integrates directly with Google Sheets for immediate analysis.
Streamline Event Check-Ins 仝 PagelootイベントQRコードジェネレーター lets you create trackable tickets, interactive schedules, and engagement touchpoints – all manageable from a single dashboard.
How to Interpret Your Scan Data
Collecting metrics is only useful if you know what they’re telling you. Here’s how to read the most common patterns.
Low total scans don’t automatically mean the offer failed. Check placement first – is the code at eye level, printed large enough, with a clear call to action nearby? Poor contrast or an unmarked code is the most common cause of low scan rates, not the content behind it. The guide to QR code engagement with heatmaps explains how to diagnose placement problems using scan density data.
High total scans but low unique scans suggests a small group is scanning repeatedly. This can indicate genuine enthusiasm, or it can mean your QR code is in a location where the same people pass it multiple times. Context matters here.
High unique scans but high bounce rate on the landing page points to a mismatch between the expectation the QR code sets and what users find after scanning. Revisit the landing page content and make sure it matches the context where the code is displayed.
Strong dwell time with low conversion is common in AR experiences where the interaction is enjoyable but the call to action isn’t prominent enough. Review where the CTA appears within the experience and whether users are reaching it before they exit.
Geographic scan data from your 位置情報分析 can reveal which areas of a multi-room venue or trade show floor drove the most activity, helping you decide booth placement and staffing levels for future events.
Time-based scan patterns identify peak engagement windows. If most scans happen during the 20 minutes after a keynote speaker mentions your activation, you have a clear signal about what’s driving traffic. Use that information to time social media posts or staff rotations accordingly.
Choosing Between Pageloot and GA4
Most events benefit from using both tools in combination, with each handling a distinct layer of tracking.
| 機能 | ページルート | Google Analytics 4 |
|---|---|---|
| リアルタイムスキャン分析 | Instant scan-level data (geo, device, time) | Available via Realtime report; requires UTM setup |
| AR-specific metrics | Dwell time, spatial analytics on supported tiers | Limited to web metrics; requires custom events |
| Unique scan tracking | Built-in device deduplication | Session/user-based; hard to tie solely to physical scans |
| Integration effort | Low – plug-and-play with dynamic redirects | Higher – needs UTM parameters and tracking scripts |
| 価格設定 | $10–$50+/month | Free (standard version) |
Use Pageloot when you need immediate insight during the event: who is scanning, from where, on which device, and how long they’re engaging. It requires no changes to your website code and is designed around QR-specific metrics including spatial analytics and dwell time.
Use GA4 when you need to understand the downstream customer journey – what users did after they landed on your page, whether they converted, and how the event contributed to longer-term campaign goals. The QRコードイベント追跡のためのトップツール page compares platform options in more detail.
For multi-day conferences or networking events, running both in parallel gives you immediate engagement feedback through Pageloot and conversion attribution through GA4.
Privacy Considerations
AR QR code campaigns collect personal data automatically upon scanning – this can include IP addresses, device identifiers, timestamps, and precise location data. Under U.S. state privacy laws such as CCPA and VCPA, you’re required to disclose what data is collected, how it’s used, and offer opt-out mechanisms.
Practically, this means:
- Update your event privacy notice to describe what happens when a QR code is scanned
- Disclose any precise geolocation tracking or behavioral targeting by your QR platform
- Audit your QR code provider’s data practices, including retention periods and third-party sharing
- Obtain explicit consent before collecting GPS-based location data
仝 geolocation analytics guide covers privacy compliance requirements in more detail, including the distinction between IP-based and GPS-based tracking and when each requires user consent.
Using Data to Optimize Future Events
The value of tracking compounds when you use it iteratively. Before your next event, compare performance across placements, time slots, and AR content types to identify what drove the most meaningful engagement – not just the most scans.
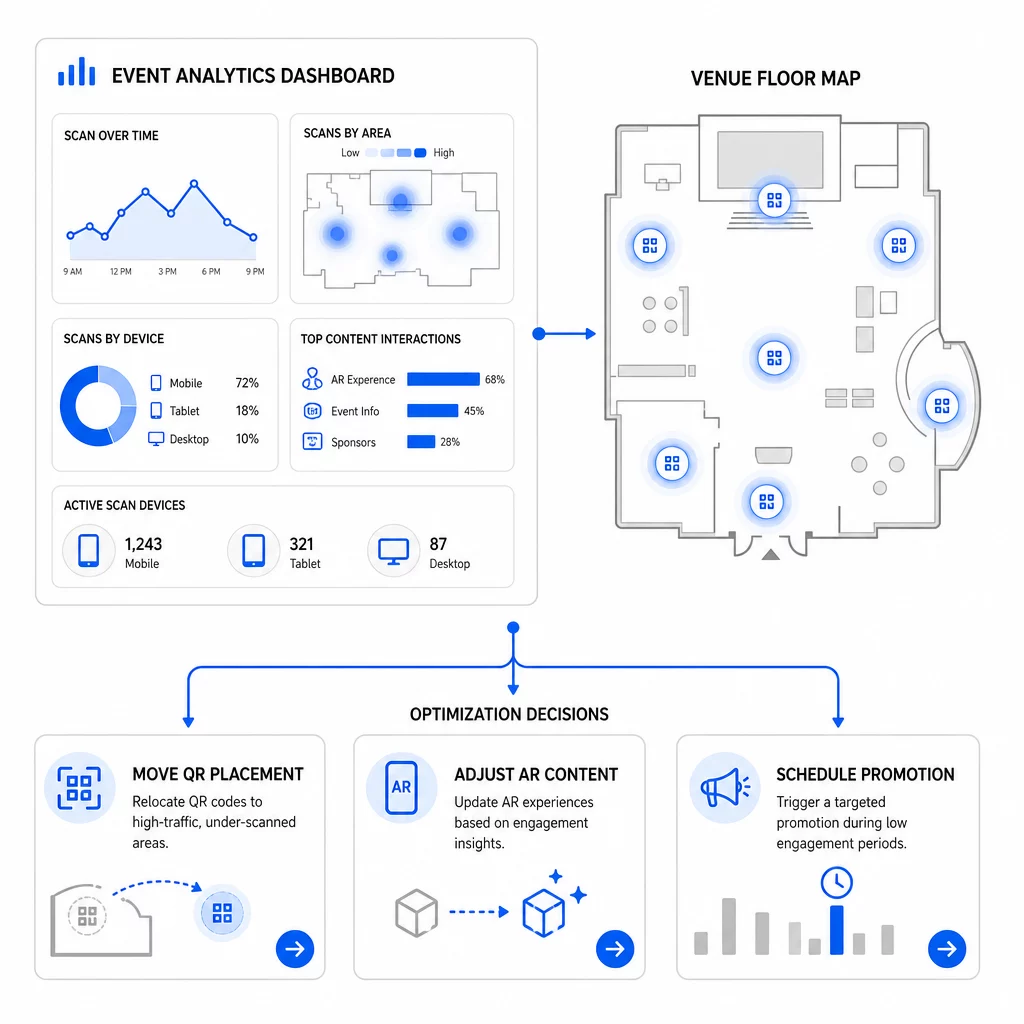
Specific optimizations to consider:
- Relocate QR codes from low-scan areas to positions near high-traffic session exits or registration areas
- Adjust AR content based on which interactive elements showed the highest dwell time
- Refine your landing page CTA placement based on where users drop off
- Schedule supporting promotions and staff activations around peak scan windows
- Focus future event investment on geographic regions where scan-to-conversion rates were strongest
Comparing key metrics before and after each change is the only reliable way to validate whether an optimization actually improved results. The QR code analytics dashboards guide walks through how to structure these comparisons inside a tracking dashboard.
The broader picture on how AR QR codes transform events is worth reviewing if you’re still in the planning stage – particularly around defining objectives before choosing which metrics to prioritize.
Tracking event success with AR QR codes isn’t just about counting scans. It’s about building a clear picture of attendee behavior across the full journey: who engaged, where they did it, how deeply they interacted, and what they did next. Set up dynamic codes with proper UTM tagging before the event, monitor spatial and dwell metrics in real time, and use post-event conversion data to sharpen the next campaign.
Start Tracking Your Event Campaigns Create dynamic, trackable AR QR codes with Pageloot’s full suite of QR features and monitor every scan from a single dashboard. Free 14-day trial, no credit card required.
よくある質問
The most important metrics are total scans, unique scans, scan frequency, time and date of scan, device and OS data, geolocation, and dwell time within the AR experience. Post-scan behavior – bounce rate, time on page, form submissions, and conversions – completes the picture by showing whether scans translated into meaningful outcomes.
The two tools serve different purposes. Pageloot captures scan-level metadata in real time – device type, location, dwell time – without requiring any website code changes. Google Analytics 4 tracks what happens after the scan: page behavior, conversion events, and the broader customer journey. For events where both immediate engagement and downstream conversions matter, using both together gives you the most complete view.
Static QR codes encode a fixed URL and provide no tracking data. Dynamic QR codes route scans through a redirect that logs time, device, and location metadata automatically. They also let you update the destination URL or linked content without reprinting materials – useful for multi-day events where schedules or calls-to-action change. You can learn more about how this works on the dynamic QR code generator page.


