
How do you know if your print ads are actually working? Without a way to measure responses, you’re guessing – and wasted ad spend adds up fast. QR codes solve this by turning every print placement into a trackable digital touchpoint, giving you concrete data on who engaged, when, and what they did next.
Why Print Ads Are Hard to Measure Without QR Codes
Traditional print advertising – magazines, direct mail, posters, flyers – has always suffered from an attribution gap. You can estimate reach based on circulation numbers, but there’s no native way to know how many readers actually responded to a specific ad, let alone what they did afterward.
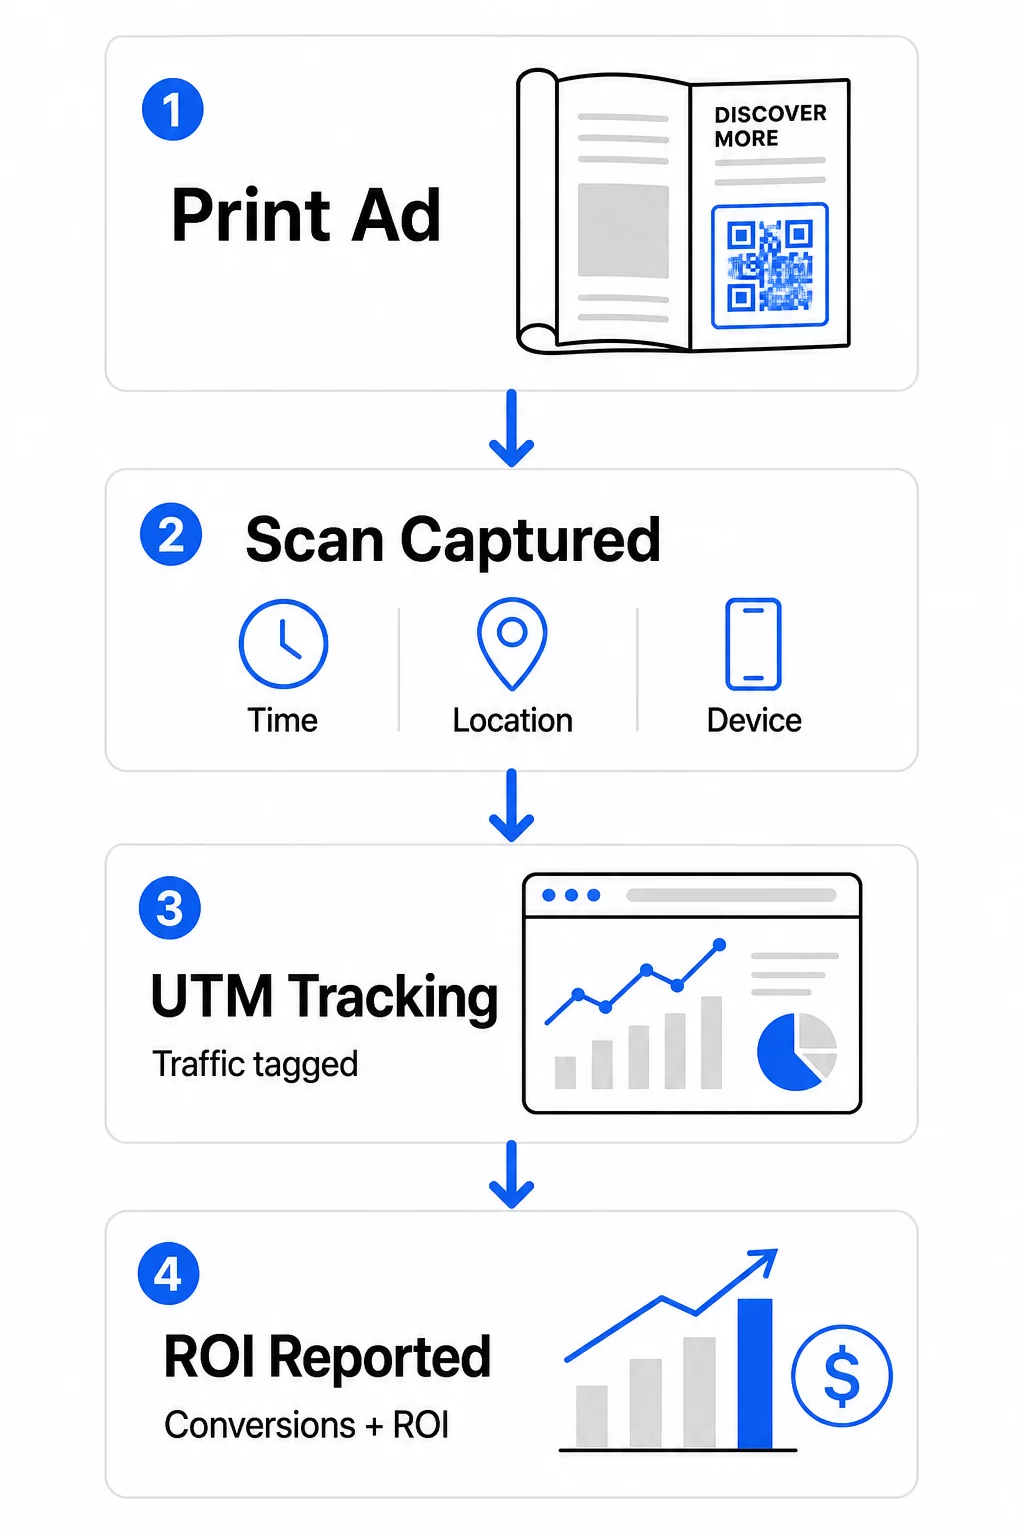
QR codes close that gap. When a reader scans a code in your print material, that action is logged digitally. You capture the scan event, the location, the device type, and the time – and if the destination URL includes UTM parameters, you can follow that user all the way through to a purchase, sign-up, or download. The offline impression becomes a measurable digital conversion.
This is why QR codes have become a standard tool for print campaign attribution. By using unique QR codes across different placements – one for each magazine, one for each direct mail batch, one per billboard location – you can compare performance across channels the same way you’d compare paid digital campaigns.
Turn Print Placements Into Measurable Campaigns Menggunakan Generator Kode QR Dinamis to create unique, trackable codes for every print placement and start capturing real engagement data.
Static vs. Dynamic QR Codes for Tracking
Not all QR codes support tracking. Understanding the difference between static and dynamic codes is the foundation of any print measurement strategy.
Kode QR statis encode the destination URL directly into the code pattern. Once printed, the destination cannot be changed, and there is no mechanism to log scan events. They work fine for linking to permanent content, but they offer no analytics.
Kode QR dinamis encode a short redirect URL instead. When scanned, the redirect resolves to your chosen destination – and the platform logs the scan event with timestamp, location, and device data. Because the redirect URL stays fixed while the destination can change, you can update the linked content at any time without reprinting your materials.
For print ad tracking, kode QR dinamis are the only practical option. They give you the scan data you need to measure campaign performance and the flexibility to adjust landing pages based on what the data shows.
Setting Up QR Codes for Print Campaign Tracking
Create Unique Codes for Each Placement
The most important rule for print tracking is one QR code per placement. If you run the same ad in three different magazines using one shared QR code, you’ll see aggregate scan counts but won’t know which publication drove results.
Assign a separate QR code to each:
- Publication or channel (e.g., each magazine title)
- Geographic distribution area (e.g., Northeast vs. West Coast mailers)
- Ad format or size (e.g., full-page vs. half-page)
- Campaign flight or time period
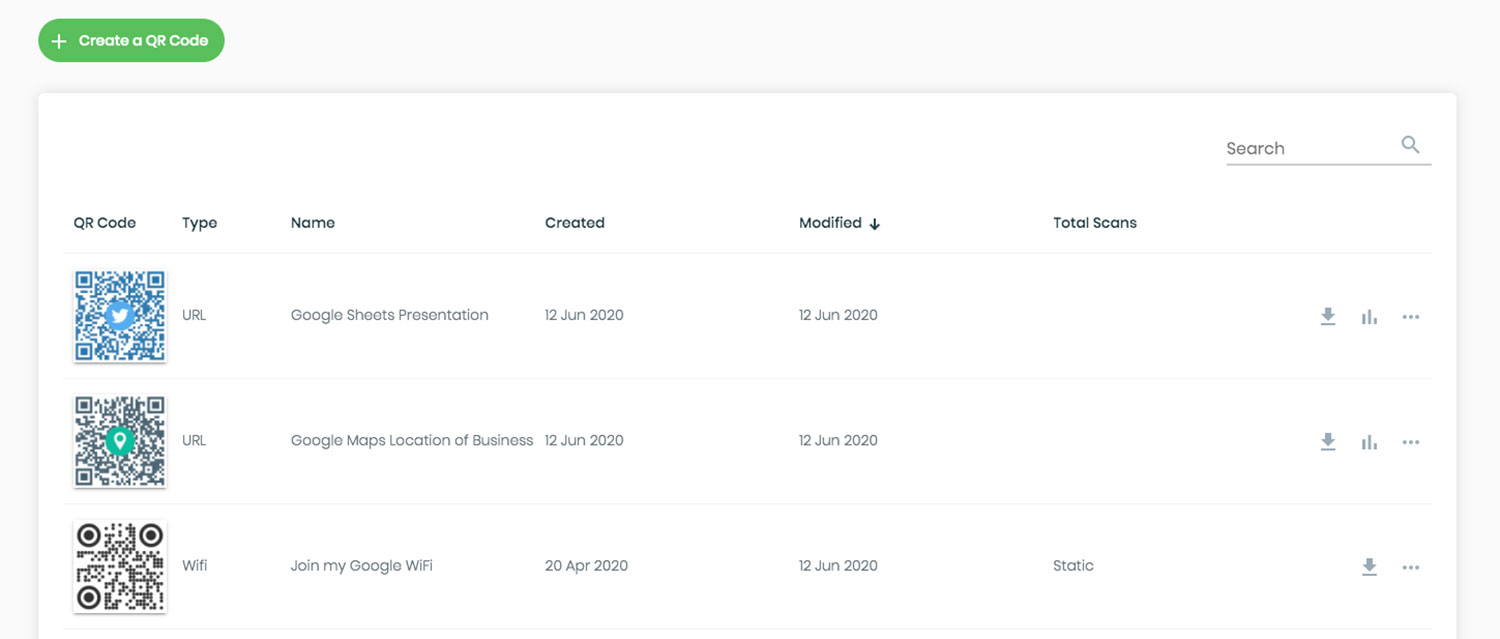
This approach lets you compare performance across placements directly and allocate future spend toward what works. Pageloot’s campaign management tools let you organize codes by campaign, assign them to sub-accounts for different teams, and manage all placements from a single dashboard.
Add UTM Parameters to Your Destination URLs
Scan data from your QR code platform tells you how many people engaged with your print ad. UTM parameters tell you what those people did after scanning. Together, they give you the full attribution picture.
UTM parameters are tags appended to your destination URL that identify the traffic source in Google Analytics. A properly tagged URL for a print campaign might look like:
`https://yourwebsite.com/landing-page?utmsource=voguemagazine&utmmedia=qrcode&utmcampaign=falllaunch_2025`
With this setup, every session that originates from that QR code scan appears in Google Analytics tagged to that specific placement. You can then measure downstream actions – purchases, form completions, content downloads – and attribute them to the print ad that generated the scan.
For a full walkthrough of naming conventions and GA4 reporting, the guide on parameter UTM untuk kode QR covers setup in detail.
Connect Print Scans to Google Analytics Pageloot analytics features let you add UTM parameters during QR code creation so every scan is automatically attributed in GA4.
Design Codes That Actually Get Scanned
Tracking only works if people scan your codes. A few technical requirements apply specifically to print materials:
- Ukuran minimum: 0.8 × 0.8 inches for standard print materials like business cards or flyers; scale up proportionally for posters and signage using the 10:1 rule – at least one inch of QR code width for every ten inches of expected scanning distance
- Kontras: High contrast between the dark modules and the light background is essential; avoid low-contrast pairings like light gray on white, and never invert the colors
- Penempatan: Eye level is ideal for posters and signage, typically between 3.5 and 5.5 feet from the ground; avoid curved surfaces like bottle labels or magazine folds where distortion can prevent scanning
- Format file: Use vector formats (EPS or SVG) for large-format printing; PNG or JPEG is sufficient for smaller materials
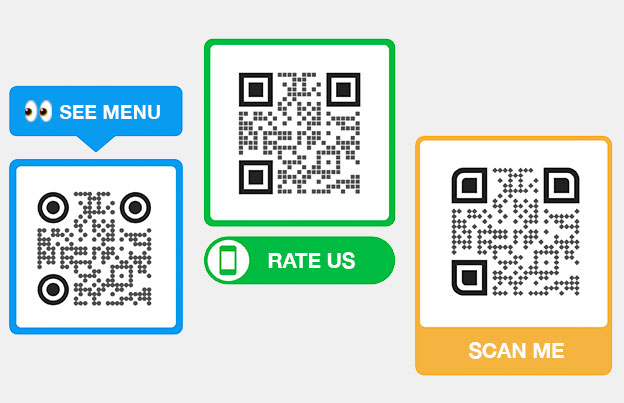
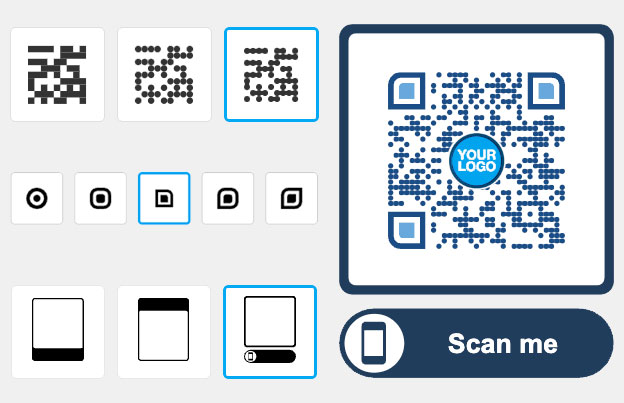
Adding a call-to-action frame – “Scan for Exclusive Offer” or “Get Instant Access” – near the code gives readers a clear reason to engage. Branded QR codes that incorporate your logo and colors also build recognition and trust. You can find detailed sizing and placement guidelines in the guide to using QR codes in print media.
The Metrics That Matter for Print Ad Attribution
Once your codes are live, the data you collect falls into two categories: engagement metrics that measure how many people responded to your print ad, and conversion metrics that measure what those people did next.
Here’s a breakdown of the key metrics to monitor:
| Metrik | What It Measures | Mengapa Ini Penting |
|---|---|---|
| Total scans | Every scan event, including repeat scans | Shows overall campaign reach |
| Unique scans | Individual devices that scanned | Reflects actual audience size |
| Scan-through rate | Scans relative to estimated ad exposure | Evaluates creative and placement effectiveness |
| Scan location | Geographic distribution of scans | Identifies high-performing regions |
| Device type | iOS, Android, desktop | Guides mobile optimization for landing pages |
| Peak scan times | When scans occur during the day or week | Informs timing strategy for future campaigns |
| Conversion rate | Actions taken after scanning (purchases, sign-ups) | Measures real business impact |
Total scans vs. unique scans is an important distinction. Total scans count every time a code is triggered, including multiple scans by the same person. Unique scans use device-level identification to count individual users, giving you a more accurate picture of actual audience reach. For print campaigns, unique scans are typically the more meaningful number.
Itu scan-through rate is the print equivalent of click-through rate – it tells you what percentage of people who were exposed to your ad actually responded. You can estimate this by dividing unique scans by the print run or estimated readership for that placement.
For a deeper look at enterprise-level analytics, the article on key QR code analytics metrics covers how to move beyond scan counts to measure genuine business impact.
Using Real-Time Analytics to Optimize Campaigns Mid-Flight
One significant advantage of dynamic QR codes over traditional print measurement is the ability to act on data while a campaign is still running. With real-time analytics, you’re not waiting until a campaign ends to learn what worked.
Practical mid-campaign optimizations include:
- Updating the destination URL if the original landing page isn’t converting well – without reprinting any materials
- Adjusting spend allocation by pausing placements with low scan rates and increasing investment in high-performing channels
- A/B testing landing pages by routing traffic from the same QR code to different destinations at different times
- Identifying geographic patterns in scan data and tailoring follow-up messaging for high-response regions
Pageloot’s real-time analytics dashboard integrates with Google Analytics, so you can view QR-driven traffic alongside your other digital channels. This gives you a complete view of how your print campaigns contribute to the overall customer journey – from the moment someone sees the ad to the final conversion.
Pantau Kampanye Anda secara Real-Time Want to see exactly where and when your customers are scanning your print materials? Use Pageloot’s QR code analytics tools to access a full performance dashboard and optimize campaigns while they’re still running.
Dynamic QR Codes for Flexible, Ongoing Campaigns
For campaigns that run across multiple placements or time periods, dynamic QR codes provide a level of flexibility that static codes can’t match. You can test seasonal offers, update destination pages to reflect current promotions, and redirect traffic without touching the printed materials.
This flexibility is especially valuable for:
- Long-running print campaigns where offers change (e.g., seasonal promotions on packaging or signage)
- Multi-location campaigns where regional landing pages need to vary
- Budget optimization where you want to redirect traffic from underperforming placements to stronger ones
Because the QR code itself never changes – only the destination it points to – your printed materials remain valid indefinitely. This eliminates reprinting costs while keeping your campaign content current.
Connecting QR codes with marketing automation tools extends this further. When a scan triggers an entry into an email sequence or CRM workflow, every print ad interaction can initiate a structured customer journey – not just a one-time website visit. Pageloot supports integrations with platforms like HubSpot and Zapier to enable these automated workflows.
Proving ROI from Print Campaigns
The ultimate goal of QR code tracking in print is proving return on investment. With the right setup, you can calculate this directly.
If you know your print campaign cost and you can attribute conversions – purchases, leads, sign-ups – back to specific QR code scans via UTM parameters and Google Analytics, you can calculate cost per acquisition for each placement. This gives you the same accountability you’d expect from digital advertising applied to offline media.
The key steps to make this work:
- Use unique QR codes for each placement so attribution is clean
- Tag destination URLs with UTM parameters so GA4 captures the full conversion path
- Set up conversion goals in GA4 for the actions that matter to your business
- Use Pageloot’s analytics dashboard to cross-reference scan data with conversion data
For teams managing multiple clients or campaigns simultaneously, the marketing agency tools in Pageloot allow you to track performance across campaigns in one place and present clean attribution reports to stakeholders. QR codes don’t just make print ads interactive – they make them measurable. By combining dynamic QR codes, UTM-tagged destination URLs, and a platform with real-time analytics, you can attribute offline print engagement to digital outcomes with the same precision you’d apply to any digital channel. Start by creating unique codes for each of your current print placements and see which ones are actually driving results.
Get started with the pembuat kode QR gratis or explore dynamic QR code tracking to see the full capabilities available for your print campaigns.
Pertanyaan yang Sering Diajukan
Yes, if you use dynamic QR codes. Dynamic codes point to a redirect URL that you control. You can update the destination – whether that’s a new landing page, a seasonal offer, or a revised UTM-tagged URL – without changing the printed QR code. The physical materials stay valid and your tracking continues uninterrupted.
Total scans count every time the code is triggered, including multiple scans by the same person. Unique scans count individual devices, giving you a clearer picture of how many distinct people responded to your ad. For measuring print ad reach and calculating scan-through rates, unique scans are typically more meaningful.
Add UTM parameters to the destination URL embedded in your QR code. When someone scans the code and lands on your website, Google Analytics records the session with those UTM tags. If you’ve set up conversion goals in GA4 – purchases, form submissions, downloads – you can see exactly how many conversions originated from each print placement. This is the core of offline-to-digital attribution for print campaigns.


