Are you struggling to prove which print campaigns or store displays actually drive sales? Investing budget in offline channels without clear attribution makes it impossible to justify costs or optimize your strategy. By pairing trackable QR codes with UTM parameters and web analytics, you can connect physical touchpoints directly to digital conversions and measure your exact return on investment.
Why Offline Campaigns Require Dynamic Attribution
Printed collateral, direct mail, and physical signage are essential marketing tools, but measuring their financial performance historically presented a challenge. When someone sees a store display or receives a postcard and later visits your website, standard web analytics classify that visitor as direct traffic or organic search. As a result, the physical touchpoint gets zero credit for the resulting sale.
Trackable QR codes bridge this gap by converting physical touchpoints into measurable digital entry points. When a customer scans a code on printed material, your analytics platform logs the scan event and tracks that user’s journey through lead forms, signups, or e-commerce purchases.
To capture accurate attribution data, you must understand the key operational differences between static and dynamic codes:
- Codici QR statici encode a fixed destination URL directly into the pixel pattern. They offer no tracking capabilities and cannot be updated after printing.
- Codici QR dinamici route the scanner through a flexible short link to your final landing page. They log scan data in real time – including scan time, location, and device type – and allow you to update destination links at any time without reprinting. Relying on i codici QR dinamici per il marketing provides the foundation required for full campaign measurement.
Building Custom UTM Parameters for Physical Touchpoints
UTM (Urchin Tracking Module) parameters are standardized text tags added to the end of a destination URL. When a smartphone camera scans a code containing these tags, web analytics tools like Google Analytics 4 (GA4) read the parameters and attribute the user session to the specific offline source. Without UTM tags, analytics platforms group QR code traffic under generic direct traffic, leaving campaign managers without visibility into which flyer, poster, or print ad drove the visit.
Structuring Your Tracking Links
A robust offline tracking link relies on specific parameter fields:
| Parametro | Scopo | Recommended Offline Formatting | Example Value |
|---|---|---|---|
| “utm_source” | Identifies the physical channel or location | Specific print item or display site | “directmailpostcard” |
| “utm_medium” | Identifies the overarching marketing medium | Standardized channel tag like “qr” or “offline” | “qr” |
| “utm_campaign” | Identifies the specific promotion or offer | Name of the promotion and year | “springsale2025″ |
| “utm_content” | Distinguishes design or placement variations | Placement detail or creative variant | “frontpaginaqr” |
| “utm_term” | Tracks target audience segments | Demographic segment or mailing list code | “existing_customers” |
Standardizing Naming Conventions
To keep your web analytics clean and prevent fragmented reporting, follow standard formatting rules:
- Use lowercase letters consistently: Analytics tools treat uppercase and lowercase tags separately, creating duplicate channel entries for “QR” and “qr”.
- Separate words with underscores: Avoid spaces, which create percent-encoding symbols (“%20”) that clutter tracking URLs.
- Maintain uniform medium tags: Apply a single medium value across all print materials so all scan traffic consolidates under one channel group in report views.
For further guidance on structuring tracking URLs for web analytics platforms, review these detailed tips on using parametri UTM per i codici QR.
Converting Tracking URLs into Dynamic QR Codes
Once you build a tagged URL, convert it into a scannable code. Using a specialized generatore di codici QR di link or a comprehensive generatore di codici QR dinamici, input your complete tagged URL (e.g., “https://yourwebsite.com/promo?utmsource=springflyer&utmmedium=qr&utmcampaign=retail_expansion”).
Best Practices for Print Deployment
To maintain high scannability and ensure reliable data capture across physical media:
- Assign unique codes per physical placement: Generate distinct dynamic QR codes with unique “utmsource” or “utmcontent” values for every physical location. Using separate codes for storefront posters and register flyers allows you to compare location performance directly.
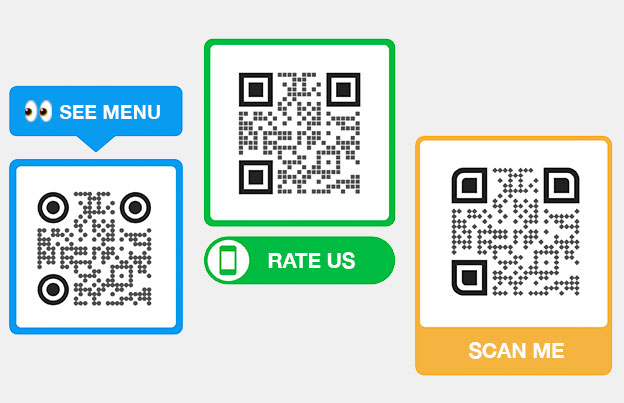
- Maintain strong visual contrast: Position dark QR code modules against a plain light background. High contrast enables phone cameras to identify and decode pixel patterns instantly.
- Apply proper print sizing guidelines: Printed materials scanned at arm’s length, such as promotional volantini or direct mail postcards, require a minimum size of 0.8 × 0.8 inches (2 × 2 cm). For larger signage, maintain a 10:1 ratio between scanning distance and code width.
- Export designs in vector file formats: Always download final QR code graphics in vector formats (.SVG or .PDF) instead of raster images like JPEGs to prevent pixelation during professional printing.
Start Tracking Your Print Campaigns Stop guessing which offline channels convert. Use Pageloot’s Generatore di codici QR dinamici to create trackable QR codes that deliver instant scan analytics and seamless ROI reporting.
Monitoring Scans and Analyzing Conversion Data
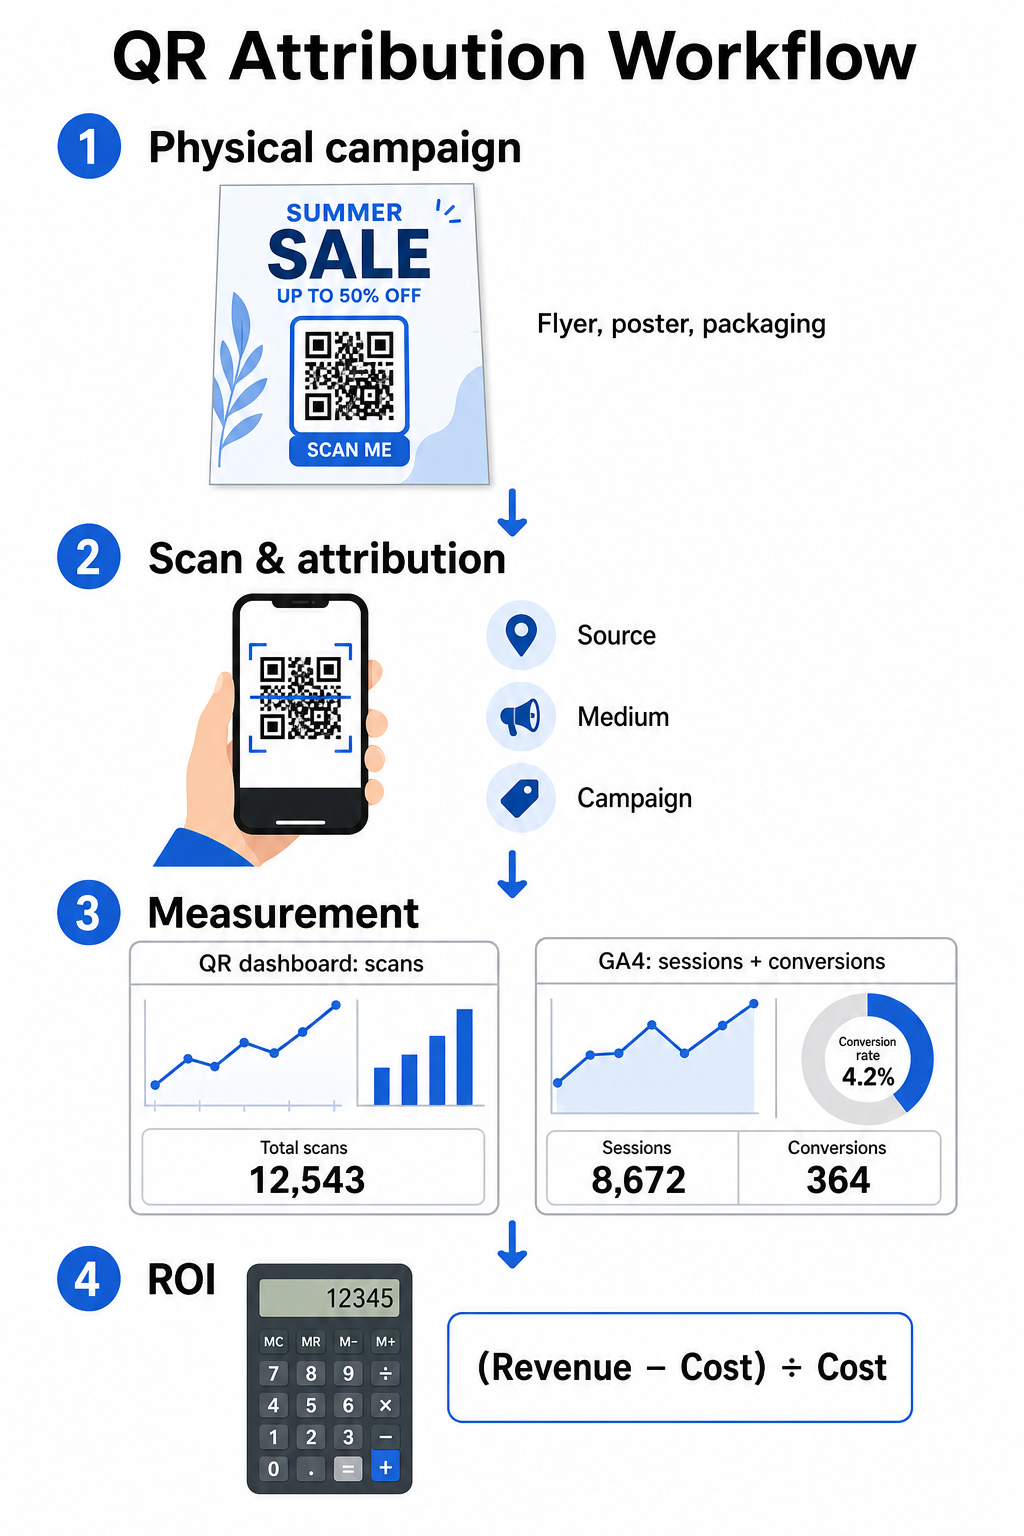
Measuring ROI requires connecting top-of-funnel physical interactions with bottom-of-funnel digital conversions. You will gather campaign data across two integrated environments: your QR management dashboard and your web analytics software.
Capturing Top-of-Funnel Data in Your Dashboard
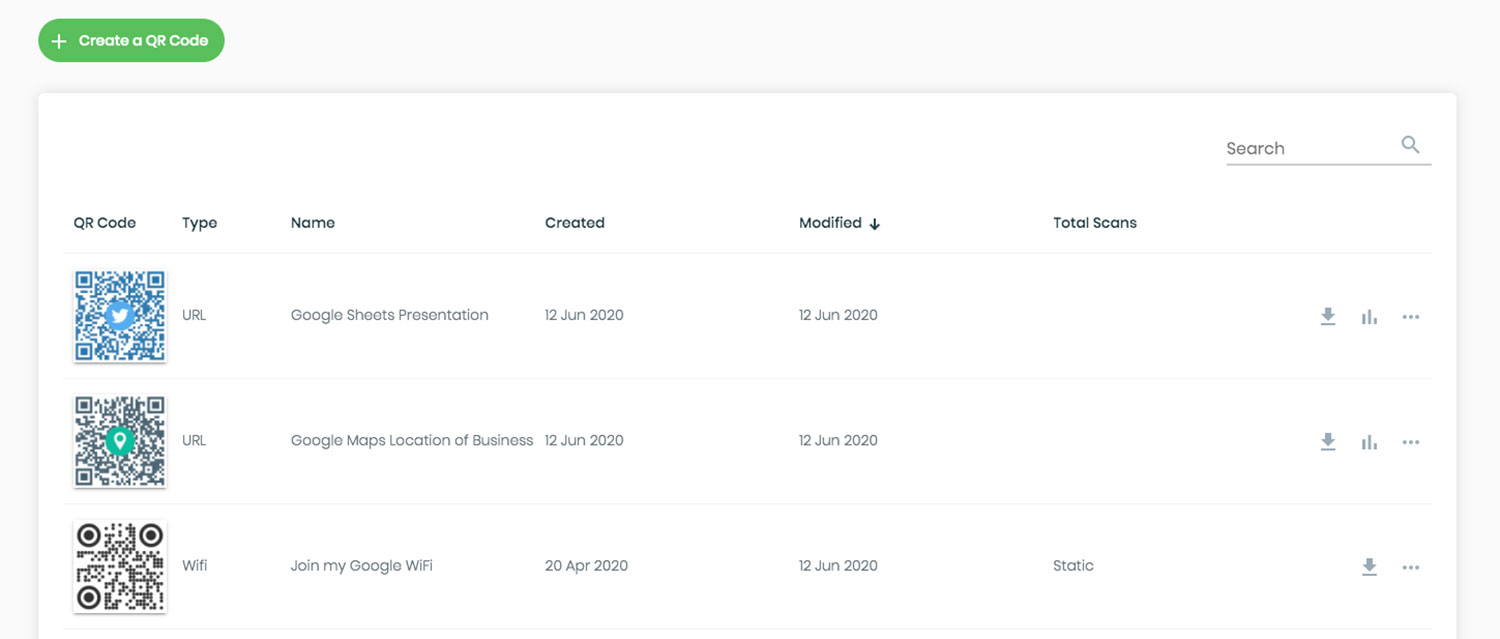
Your QR management platform records physical scan interaction data immediately. When you tracciare le scansioni dei codici QR in tempo reale, your dashboard displays critical engagement metrics:
- Total vs. unique scans: Total scans record every scan instance, while unique scans isolate individual device interactions.
- Geographic scan distribution: Maps pinpoint top-performing cities and postal regions.
- Engagement timing trends: Hourly and daily scan distributions reveal peak activity windows for target audiences.
- Device operating systems: Operating system metrics ensure landing pages function seamlessly across iOS and Android devices.
Using a central dashboard di analisi dei codici QR gives campaign managers immediate performance feedback without waiting for web analytics processing delays.
Evaluating Conversions in Google Analytics 4
While your scan dashboard measures physical interactions, GA4 tracks user behavior after visitors arrive on your website.
To evaluate campaign traffic in GA4:
- Navigate to Reports > Acquisition > Traffic acquisition.
- Change the primary reporting dimension to Session source / medium oppure Session campaign.
- Search for your custom medium tag (such as “qr”).
- Analyze key performance indicators, including Engaged sessions, Engagement rate, e Key events (conversions).
When online actions – such as e-commerce purchases, form submissions, or newsletter signups – are designated as key events in GA4, the platform attributes those conversions directly back to your print campaign source parameters.
Calculating Campaign ROI and Performance Metrics
Once campaign expenditure is recorded and attributed revenue is tracked in web analytics, you can calculate exact Return on Investment (ROI) using standard financial formulas.
The ROI Calculation Formula
Calculate campaign ROI using the standard equation:
ROI (%) = [(Attributed Revenue − Total Campaign Cost) ÷ Total Campaign Cost] × 100
Practical ROI Calculation Example
Consider a direct mail flyer campaign created to generate online service bookings:
- Total Campaign Cost: $2,500 (covering graphic design, printing, and postage).
- Total QR Scans: 800 total scans (650 unique scans).
- Attributed Web Conversions: 50 completed bookings originating from “utmsource=directmail_flyer”.
- Total Attributed Revenue: $6,000 in direct sales revenue.
Applying the calculation formula:
ROI = [($6,000 − $2,500) ÷ $2,500] × 100 = ($3,500 ÷ $2,500) × 100 = 140%
The campaign generated a 140% net return on investment.
Secondary Efficiency Metrics
To compare efficiency across different physical materials and placements, monitor these supporting performance indicators:
- Cost per Scan (CPS): Divide total campaign cost by total scans ($2,500 ÷ 800 = $3.12 per scan).
- Scan-to-Conversion Rate: Divide attributed conversions by unique scans and multiply by 100 ((50 ÷ 650) × 100 = 7.69%).
- Cost Per Acquisition (CPA): Divide total campaign cost by attributed conversions ($2,500 ÷ 50 = $50.00 per conversion).
- Revenue Per Scan (RPS): Divide total attributed revenue by total scans ($6,000 ÷ 800 = $7.50 per scan).
Comparing Performance Across Offline Media
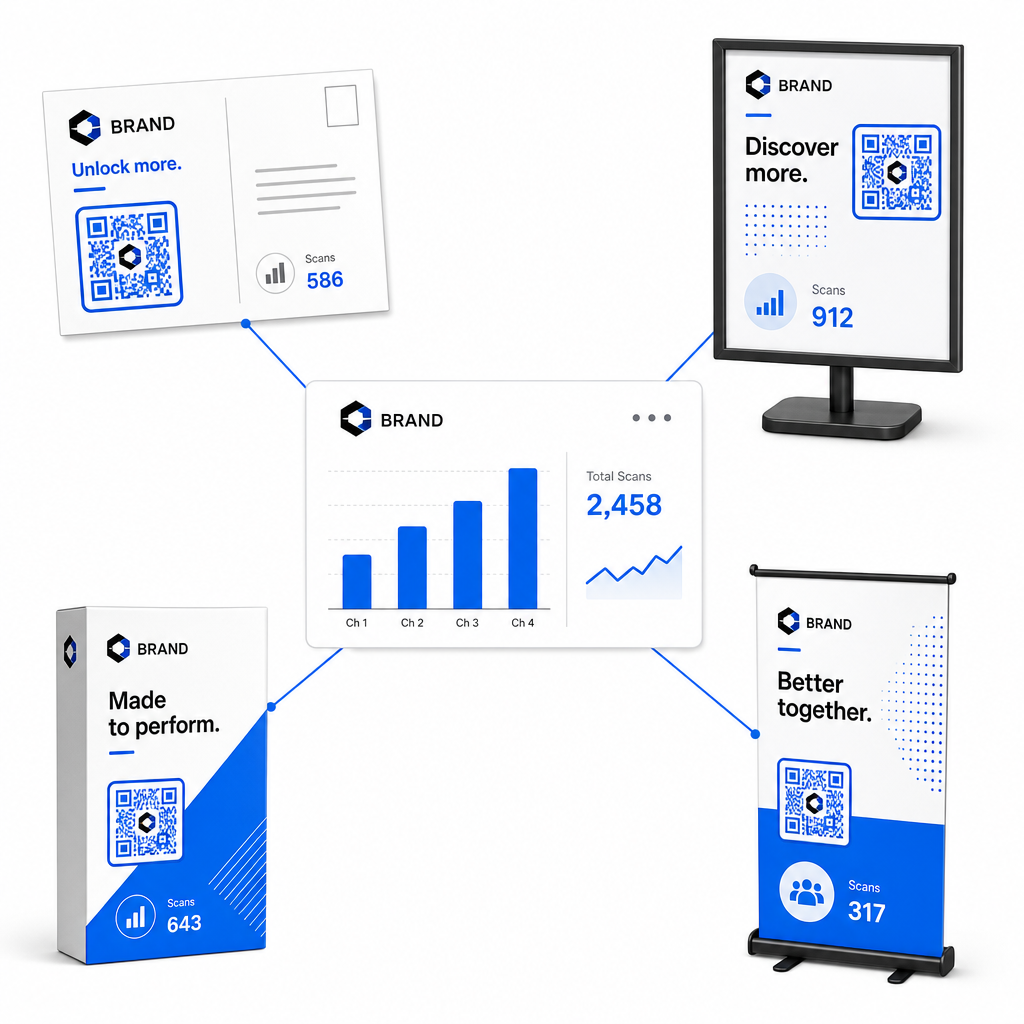
Evaluating performance across physical placements helps allocate future print budgets toward high-yielding collateral types.
| Marketing Material | Target KPI | Optimization Strategy |
|---|---|---|
| Direct Mail & Postcards | Conversion Rate & CPA | Position a clear incentive or discount offer directly adjacent to the code. |
| In-Store Posters & Displays | Scan Volume & Scan Velocity | Adjust display height and move codes toward high-traffic eye-level focal points. |
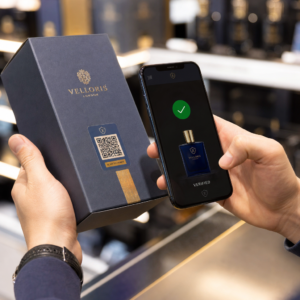
| Imballaggio del prodotto | Repeat Scans & Engagement Rate | Direct users to digital instruction manuals, warranty activation forms, or reorder discounts. |
| Event Signage & Banners | Lead Capture Rate | Offer downloadable resources or promotional giveaways in exchange for contact information. |
To explore additional strategies for implementing codes across traditional print media, review this guide on Tracciamento dei codici QR.
Guidelines for Maximizing Offline Campaign Scans
To maximize conversion rates and maintain accurate campaign data, follow these core operational standards:
- Include clear action-oriented text: Avoid printing standalone codes without context. Place explicit calls-to-action beside the code frame, such as “Scan to unlock 15% off your purchase” oppure “Scan to view full menu”.
- Optimize mobile landing pages: Scanning occurs exclusively on mobile devices. Ensure target pages load in under two seconds and feature thumb-friendly layout designs.
- Test tracking URLs prior to mass distribution: Perform live scan tests across multiple mobile OS devices to confirm that all UTM tags pass cleanly to the landing page and record in real-time analytics.
- Update destination links dynamic management: If landing page links change or promotions update, use your administrative dashboard to change destination URLs without reprinting collateral. Learn more about effective execution in this resource on come utilizzare i codici QR.
Combining dynamic management features with structured UTM links transforms print media into a predictable, measurable growth channel. Create custom dynamic codes with the Generatore di codici QR di Pageloot to gain complete measurement over your print marketing investment.
Domande Frequenti
Yes, dynamic QR code management platforms automatically track scan volume, device operating systems, scan timestamps, and geographic locations. However, appending UTM parameters to destination links allows web analytics and CRM platforms to attribute downstream website sessions, purchases, and lead form submissions back to your specific physical campaign.
If you generated dynamic QR codes, you can update the destination URL and UTM parameters at any time through your management dashboard without reprinting your physical artwork. Static QR codes encode the target web address permanently into the print design and cannot be modified once printed.
Assign a unique dynamic QR code with distinct UTM parameters (such as “utmcontent=windowposter” vs “utmcontent=checkoutflyer”) to each physical location or collateral type. This setup allows you to isolate scan volumes, conversion rates, and attributed revenue across individual placements in your analytics reporting.