Are your AR QR codes failing to scan – or worse, launching an experience that users abandon before it loads? Poor design and slow-loading AR content frustrate users and waste your campaign budget. This guide covers every decision that affects scan reliability and post-scan engagement, from minimum code size to AR file optimization.
Design Fundamentals That Affect Scan Reliability
The physical appearance of an AR QR code determines whether it gets scanned at all. Before worrying about the AR experience itself, these foundational choices need to be right.
Size and Format Requirements
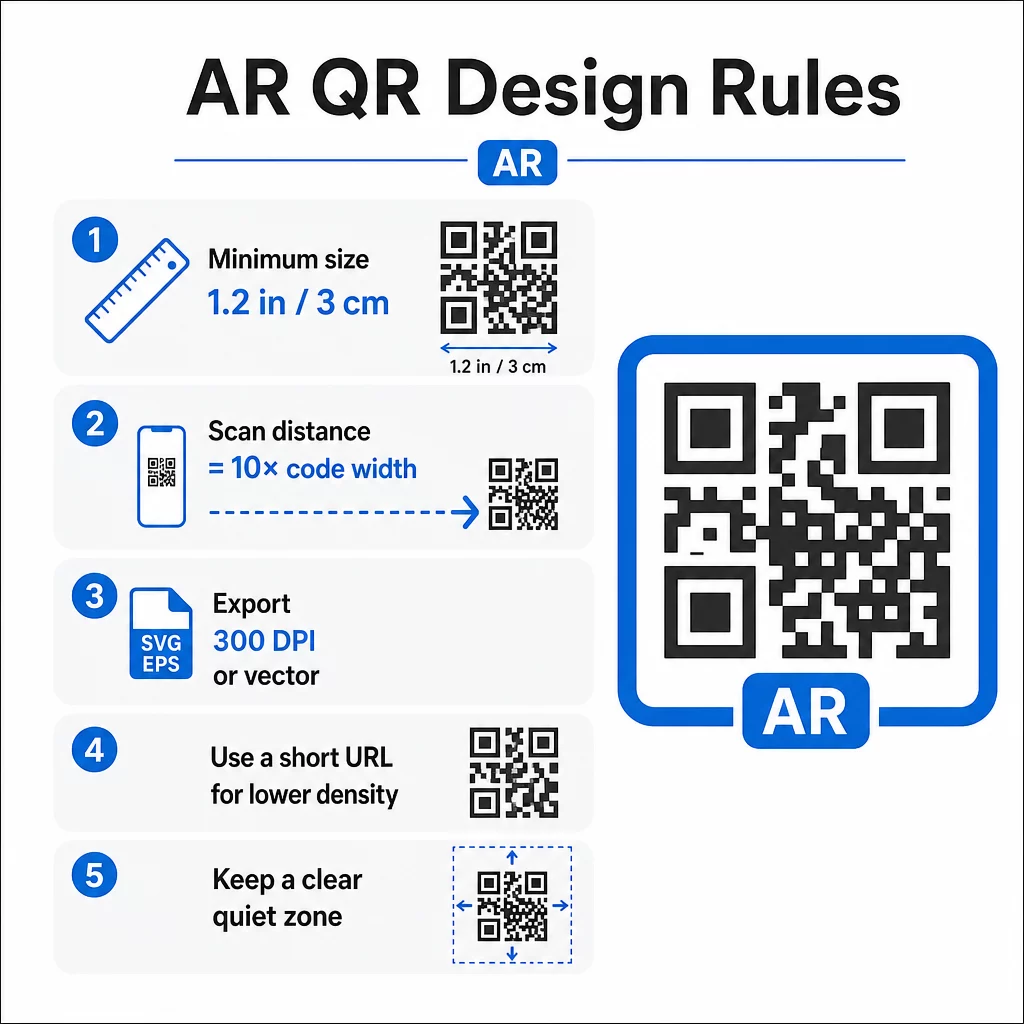
For reliable scanning, print your AR QR code at a minimum of 1.2″×1.2″ (approximately 3 cm×3 cm). This gives most smartphone cameras enough data to decode the pattern without users needing to hold their phone uncomfortably close. A practical rule: the scanning distance should be roughly ten times the code’s width. A 2″ code can be scanned from about 20 inches away.
For specific placements:
- Product packaging: at least 0.8″×0.8″
- Posters or displays viewed from 3–6 feet: at least 2″×2″
- Large-format surfaces like billboards: scale proportionally for the expected viewing distance
Always maintain a square aspect ratio. Even slight stretching distorts the module pattern and makes the code unscannable. If your design software applies aspect ratio constraints during export or resizing, double-check the final file dimensions before printing.
Print quality matters just as much as size. Use a minimum of 300 DPI for any raster format, and export in vector formats like SVG or EPS whenever possible. These scale without quality loss and are the standard for professional print production. If vector isn’t an option, a high-resolution PNG is the next best choice.
Also consider the URL you’re encoding. Shorter URLs produce less dense QR patterns, which are easier to scan – especially at smaller sizes or from greater distances. If your AR platform generates a long destination URL, run it through a เครื่องสร้างรหัส QR สำหรับลิงก์ that encodes a short redirect instead of the full URL.
Color Contrast and Scanning Reliability
Contrast is what allows a camera to distinguish the code’s modules from its background. The classic black-on-white combination offers maximum contrast and remains the most reliable choice. If you’re using brand colors, aim for a contrast ratio of at least 4:1 between the foreground modules and the background. Going lower than 3:1 significantly increases scan failures in variable lighting.
Dark foregrounds on light backgrounds work well. Navy blue, dark green, or burgundy on white or cream backgrounds are reliable branded alternatives to pure black. Reversing this – light modules on a dark background – is problematic. Many QR scanners are not calibrated for inverted designs, and glossy dark surfaces introduce glare that further degrades performance.
Avoid these color combinations entirely:
- Yellow on white
- Light gray on white
- Any pastel-on-pastel pairing
- Red on green or blue on orange (these also create barriers for users with color vision deficiencies)
For AR QR codes printed on glossy packaging, test extensively under multiple lighting conditions. Glare can render a perfectly designed code unscannable. Matte finishes or UV coatings reduce reflectivity without compromising durability. Keep the background behind the code completely uniform – patterns, gradients, or textures interfere with the scanner’s ability to read module boundaries.
For a deeper look at contrast guidelines, see แนวทางปฏิบัติที่ดีที่สุดสำหรับความคมชัดของสีรหัส QR.
ข้อกำหนดของพื้นที่ว่าง (Quiet Zone)
The quiet zone is the blank margin surrounding the QR code. Scanners use it to identify where the code begins and ends – without it, surrounding design elements bleed into the code and cause failures.
The minimum quiet zone is สี่โมดูล on all sides. A module is the smallest square unit in the code pattern. If each module measures 0.05 inches, the quiet zone must be at least 0.2 inches. For AR codes placed in visually busy environments like retail displays or museum walls, extending the quiet zone to six or eight modules adds meaningful reliability.
Keep these rules in mind:
- No text, logos, or design elements should appear inside the quiet zone
- Borders and frames must be placed outside the quiet zone, not touching the code
- If you’re experiencing scan issues in testing, expanding the quiet zone is often the first fix to try
Print a test version at actual size and scan it across multiple devices. If any fail, check the quiet zone before adjusting other design elements.
For further guidance on making QR codes easier to scan, including quiet zone and sizing specifics, Pageloot’s readability guide covers these in practical detail.
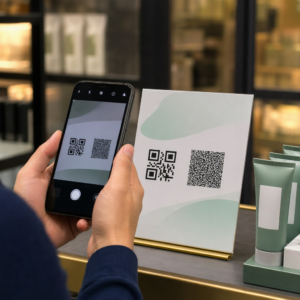
Adding Branding Without Compromising Function
Branded QR codes can receive significantly more scans than plain black-and-white codes – trust and recognition play a real role in whether someone decides to scan. The design challenge is adding visual identity without disrupting the underlying pattern.
Logo Placement Guidelines
Center placement is standard because QR codes are built with error correction that handles obstructions in the middle more gracefully than at the edges. Keep your logo within 15–20% of the total code area. If the logo is complex or detailed, simplify it – a clean, high-contrast mark works better than an intricate one that introduces ambiguity near code modules.
Practical steps when adding a logo:
- Use design tools to scale the logo precisely before embedding it
- Ensure the logo doesn’t obscure the three corner finder patterns, which are essential for scanner orientation
- Test the branded code on multiple devices, including older models with lower-resolution cameras
- ใช้ของ Pageloot เครื่องสร้างรหัส QR พร้อมโลโก้ to preview and confirm scannability before finalizing
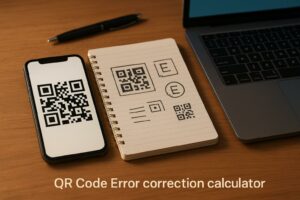
Understanding Error Correction Levels
QR codes include built-in error correction that allows them to remain readable even when part of the pattern is obscured or damaged. Four levels are available:
| ECC Level | Data Recovery | Safe Logo Size | หมายเหตุ |
|---|---|---|---|
| L | ~7% | ≤10% of code area | Best for simple designs without logos |
| M | ~15% | 10–15% of code area | Balanced for branding and reliability |
| Q | ~25% | 12–18% of code area | Works well with simple logo shapes |
| H | ~30% | 15–20% of code area | Ideal for centered logos; always test thoroughly |
For branded AR QR codes, ระดับ H is the right choice – especially in environments where the code may get scratched, partially covered, or scanned under challenging lighting. If you’re designing a logo-free code for a simple, controlled environment, Level M may be sufficient.
For a full walkthrough on วิธีเพิ่มโลโก้ลงในคิวอาร์โค้ด without affecting scannability, including common mistakes and fixes, Pageloot’s logo guide covers the process step by step.
Picking Brand Colors for QR Codes
High contrast between modules and background is non-negotiable. If your brand palette naturally produces strong contrast, applying it is straightforward. For lighter palettes, use darker shade variations for the modules rather than the brand’s primary color.
Stick to two or three colors to keep the design clean. Avoid combinations that reduce contrast, such as light gray on white, yellow on light blue, or pastel pairings. When designing AR QR codes for campaigns, test your color choices across different printing methods and lighting conditions – what looks good on screen can behave differently on paper.
Pageloot’s customization tools let you preview color combinations and check contrast before generating the final code. For more examples of branded codes that work well in real campaigns, see 7 examples of branded QR codes.
Technical Setup for AR QR Codes
Design gets users to scan. Technical setup determines what happens next and whether it works consistently.
Choosing the Right QR Code Generator
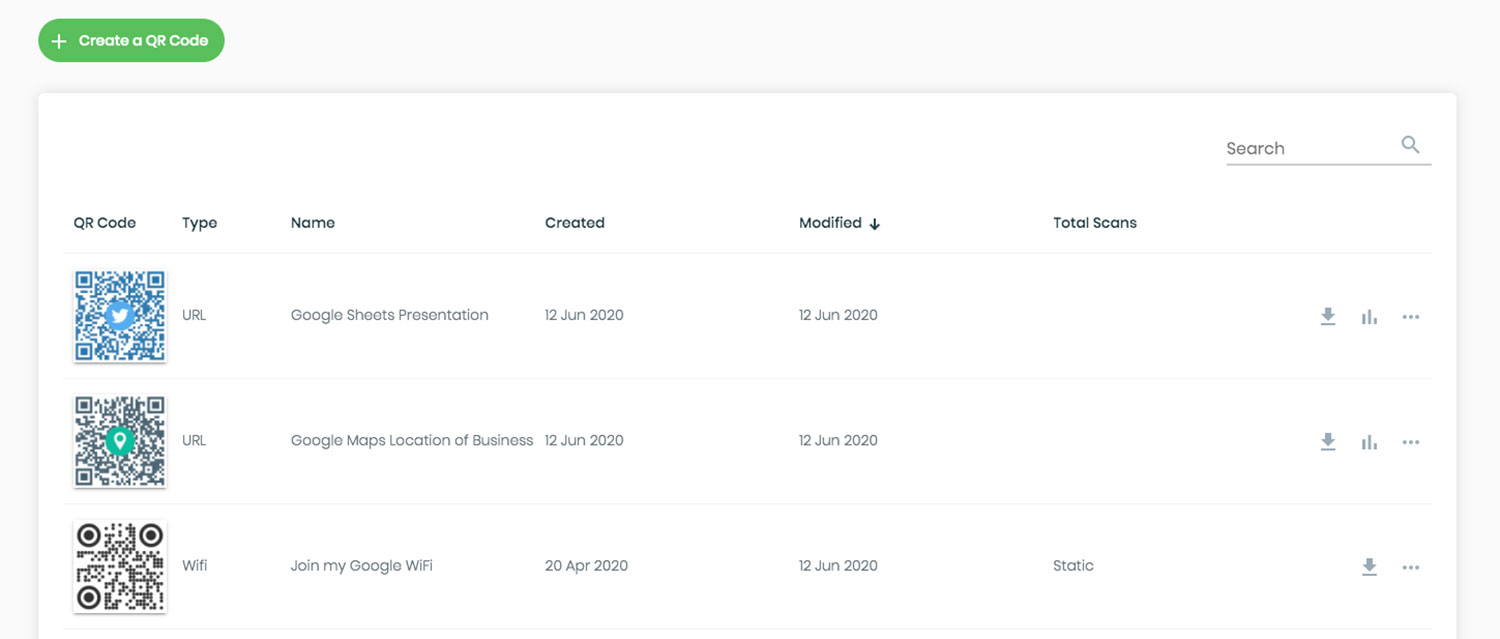
The QR code generator you use directly affects your AR campaign’s flexibility and performance. The most important capability to prioritize: คิวอาร์โค้ดแบบไดนามิก.
A dynamic QR code encodes a short redirect URL rather than the final destination. That redirect can be updated at any time – even after the code has been printed and distributed. For AR campaigns, this matters because AR experiences often need adjustments: updated 3D models, revised landing pages, or new product information. With a static code, any change requires reprinting everything. With a dynamic code, you update the destination in your dashboard and every existing code points to the new content automatically.
Dynamic codes also support scan analytics, which are essential for understanding campaign performance. You can track how many times a code was scanned, when, from which location, and on which device type.
Keep AR Campaigns Flexible Need to update your AR experience without reprinting physical materials? Use the เครื่องสร้างคิวอาร์โค้ดแบบไดนามิก to create codes you can edit anytime, with built-in scan analytics to measure performance.
For AR QR codes on products or packaging, choose a generator with high error correction options and full customization support. Analytics features help you identify which placements perform best and where to focus optimization efforts.
How AR QR Codes Actually Work
It’s worth understanding the mechanism so you can make informed decisions about your AR platform. A QR code contains a URL. When scanned, that URL opens in the device’s browser or in a compatible app. The AR content is then delivered through that destination – either as a web-based AR experience (WebAR) or through a dedicated app.
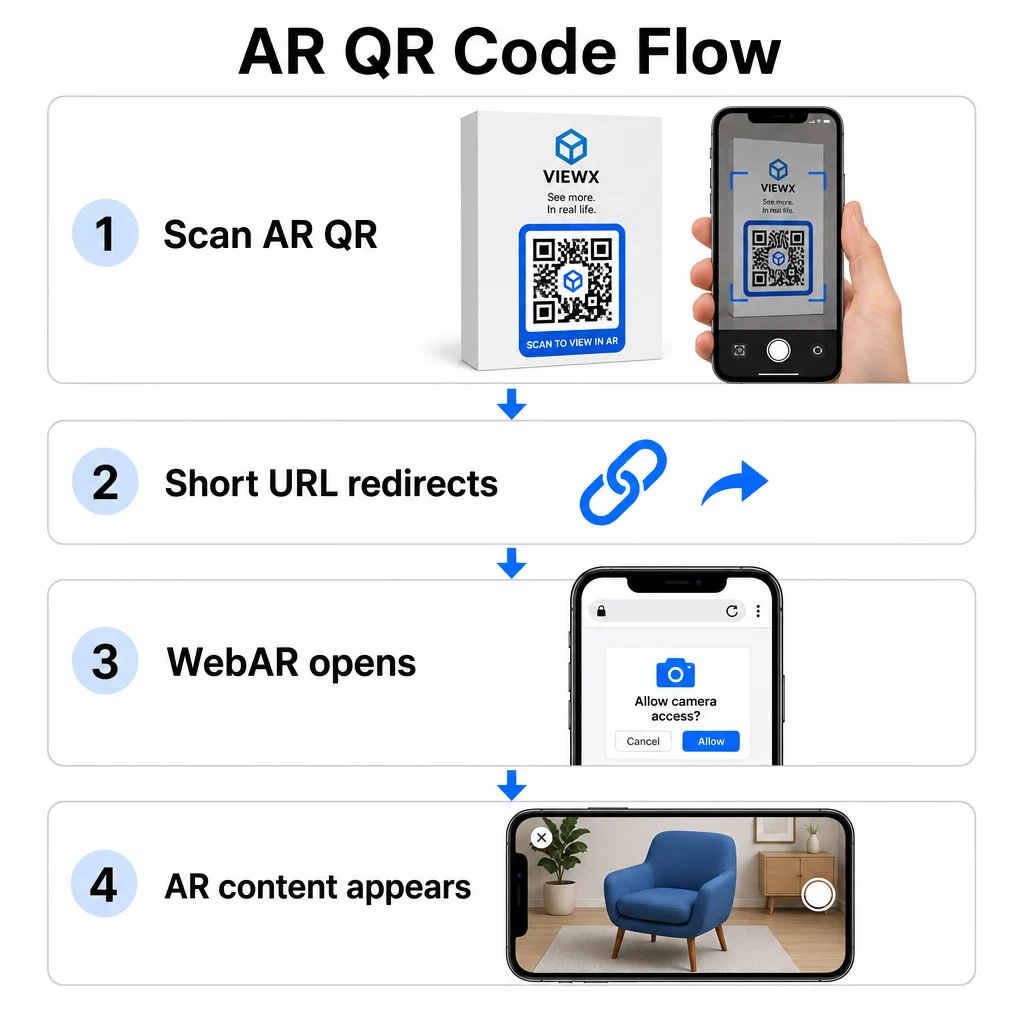
WebAR is particularly well-suited for campaigns because it requires no app download. Users scan the code, their browser opens, and the AR experience launches using the device camera and sensors. This reduces the friction that causes drop-off and works across iOS and Android without a separate installation step. WebAR can be built with technologies like A-Frame with AR.js for marker-based tracking or Google’s “ for markerless AR.
If your AR experience requires capabilities beyond what WebAR supports – complex interactions, persistent AR, or specific hardware features – an app-based approach may be necessary. In that case, your QR code should link to a smart redirect that routes iOS users to the App Store and Android users to Google Play.
For most marketing, packaging, and event use cases, WebAR launched from a รหัส QR แบบไดนามิก is the lowest-friction and most maintainable approach. AR QR codes have been used effectively across museum storytelling, art installations, และ marketing agency campaigns – and in each case, the ability to update content without reprinting is a significant operational advantage.
Optimizing AR Content for Speed
Once someone scans your code, they expect the AR experience to appear within 2–3 seconds. Anything longer significantly increases the chance they’ll leave before it loads.
Key optimization targets:
- Keep 3D model files under 5 MB; use compressed formats like GLTF or GLB for web-based AR
- Keep video files under 10 MB and use H.264 encoding
- Reduce image texture resolutions to 1024×1024 pixels or smaller; use solid colors or procedural textures where possible to minimize file sizes
- Use progressive loading – display a simplified version of the AR content first, then load higher-quality details in the background
- Test loading performance on 3G and 4G connections, not just Wi-Fi; if performance is poor on weaker connections, simplify the content or offer a lighter version
Host AR assets on fast, reliable infrastructure. Slow or unreliable hosting will undermine even the most well-optimized files.
Testing and Launching AR QR Codes
No amount of careful design replaces real-world testing. AR QR codes encounter conditions that are impossible to fully simulate on a screen.
Testing Across Environments
Test in the actual conditions where your code will be used: direct sunlight, fluorescent indoor lighting, low-light settings. Bright sunlight on glossy surfaces is particularly challenging – matte materials significantly improve visibility in these conditions.
For codes on screens or digital displays, test scannability from different angles, heights, and distances. For printed codes, test on the exact materials you’ll use – performance differs between matte paper, glossy packaging, and textured substrates.
Connectivity affects AR more than it affects standard QR code destinations. Even a code that scans perfectly can deliver a broken experience if the AR assets fail to load on a weak signal. Test in areas with varying signal strength.
Testing on Multiple Platforms
iOS devices have built-in QR scanners, but behavior varies across iPhone models and iOS versions. Test on several generations. Android variation is more significant – camera quality and processing power differ considerably between budget and premium models. Test on a range of both.
For web-based AR, confirm the experience loads correctly in Safari, Chrome, and Firefox. Check across different screen sizes and orientations. If your AR experience requires camera permissions, verify that the browser prompt appears and functions correctly on each platform.
For a comprehensive approach to cross-device testing, see Pageloot’s guidance on แนวทางปฏิบัติที่ดีที่สุดในการใช้งานรหัส QR.
Tracking Performance with Analytics
After launch, analytics tell you what’s actually happening with your codes. With dynamic QR codes and scan tracking, you can monitor performance in real time and make adjustments without reprinting.
Key metrics to monitor:
| เมตริก | What It Reveals | Action to Take |
|---|---|---|
| Total scans / Unique users | Campaign reach and volume | Test new placements or CTAs if numbers drop |
| Time-of-day activity | When users engage most | Adjust display timing for peak hours |
| Device / OS split | Platform performance | Optimize for platforms with lower engagement |
| Geographic hotspots | Where scans occur | Focus resources on high-performing areas |
| Post-scan conversion | User actions after scanning | Simplify landing pages or clarify the offer |
Review analytics weekly during active campaigns. Patterns in device type or location data often reveal placement or design issues that weren’t visible during testing.
Improving the Experience After Scanning
A smooth scan is just the entry point. The post-scan experience determines whether users engage with your AR content or abandon it.
Mobile-Optimized Design
Every aspect of the post-scan experience should be designed for a phone screen. Responsive layouts are essential – your landing page and AR content should adapt to different screen sizes and orientations without breaking.
Interactive elements like buttons and calls-to-action should be at least 44×44 pixels and placed in thumb-friendly areas – the center and lower portions of the screen. Leave enough space between tap targets to prevent accidental presses.
Simplify the path to AR content. For WebAR, the experience should launch directly in the browser with no additional plugins required beyond camera access. Every extra step increases drop-off. For mobile QR code landing pages, Pageloot’s guide covers the specific design and load-time requirements that keep users engaged after scanning.
If you’re delivering multiple content options from a single scan, a branded landing page that links to your AR experience alongside other relevant content can improve the overall experience.
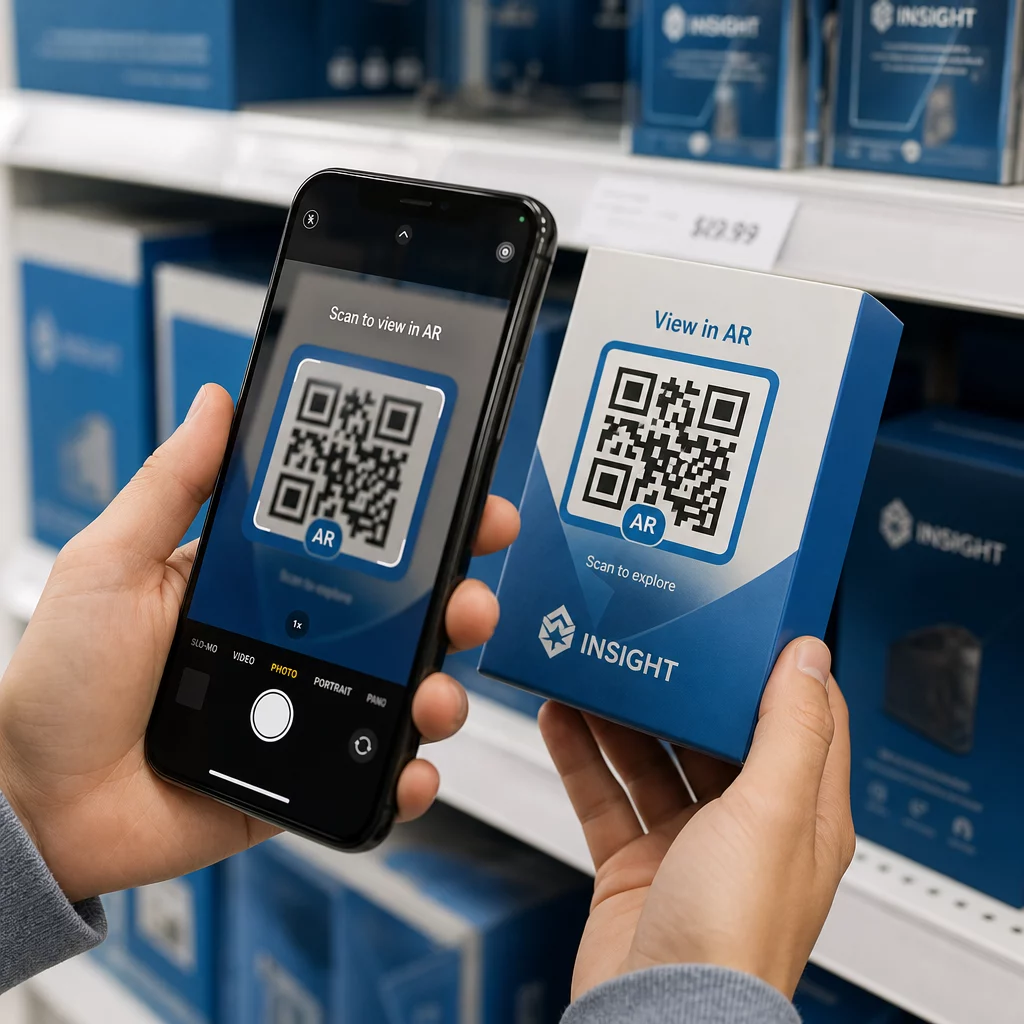
Clear Instructions for AR Content
Users unfamiliar with AR need to know what’s about to happen and what to do. Add a clear call-to-action near the physical QR code itself – something like “Scan to view in 3D” or “Scan to see this product in your space.” The incentive to scan should be obvious before anyone points their camera.
Once inside the AR environment, guide users with simple on-screen prompts:
- “Point your camera at the product packaging to activate AR”
- “Slowly move your phone to scan the surface”
Position interactive elements – “Add to Cart,” “Learn More,” “Share Your Experience” – so they’re easy to find without blocking the AR content. Use progressive disclosure: start with the simplest controls and introduce advanced features as users get comfortable.
Personalization and Accessibility
Dynamic QR codes make it practical to tailor content based on location, time, or previous interactions. In retail settings, this could mean showing products relevant to the user’s region or adjusting content language based on scan location.
Accessibility considerations that apply to AR experiences:
- Add text descriptions for all visuals and ensure screen reader compatibility
- Offer adjustable text sizes, contrast levels, and audio volume
- Provide closed captions for audio content
- Include multiple language options where relevant
- Avoid relying solely on color to convey information – use icons, text labels, or patterns as supplements
Dynamic QR codes make language updates easy: you can add or change options without reprinting any physical materials.
การรวบรวมทั้งหมดเข้าด้วยกัน
Reliable AR QR codes are the result of decisions made across design, technical setup, and post-scan experience – not any single factor. Get the size, contrast, and quiet zone right. Choose error correction and branding that preserve scannability. Use dynamic codes so your AR content stays current without reprinting. Test thoroughly across devices and environments, then use analytics to keep improving after launch.
Start Building AR QR Codes ใช้ Pageloot เครื่องสร้างรหัส QR to create dynamic, branded codes with built-in analytics – then keep your AR experience current without ever needing to reprint.
คำถามที่พบบ่อย
Test on a range of iOS and Android devices, including older models, across multiple lighting environments – direct sunlight, fluorescent indoor light, and low-light settings. Use high contrast (at least 4:1 ratio), maintain a clear quiet zone, and avoid glossy surfaces where possible. Dynamic QR codes let you update the linked AR experience if compatibility issues arise after launch.
Keep your logo within 15–20% of the total code area, centered, and use Level H error correction to compensate for the obstruction. Maintain high contrast between the code modules and background, and preserve the quiet zone around the code. Always test the branded code on multiple devices and under varied lighting before printing at scale.
Keep 3D model files under 5 MB using compressed formats like GLTF or GLB, limit video files to under 10 MB with H.264 encoding, and reduce image texture resolution to 1024×1024 pixels or smaller. Use progressive loading to show a simplified version first while higher-quality assets load in the background. Test performance on 3G and 4G connections, not just Wi-Fi, to reflect real-world conditions.


