How do you know if your location-based QR campaign is actually working? Without the right metrics, you’re spending money on printed materials with no way to prove their impact. This guide breaks down the seven metrics that give you a clear, data-driven picture of campaign performance – from the first scan to the final conversion.
What Makes Location-Based QR Campaigns Measurable
Location-based QR code campaigns connect offline placements – posters, packaging, in-store displays, event materials – to digital experiences. Unlike website traffic, these interactions start in the physical world, which creates an attribution challenge: how do you tie a scan in Austin to a purchase in your e-commerce platform?
The answer is dinamikus QR kódok. Unlike static codes, dynamic QR codes route scans through a redirect server that logs data before sending the user to the destination. This intermediate step is what makes tracking possible. You can capture when, where, and how a scan happened – and update the destination URL without reprinting a single material.
QR-kód követés works by assigning each code a unique redirect link tied to your campaign. Every scan generates a data event that your analytics platform records. Pair that with UTM parameters embedded in the destination URL and you can push scan data directly into Google Analytics 4, your CRM, or a marketing automation tool.
With that foundation in place, here are the seven metrics worth tracking.
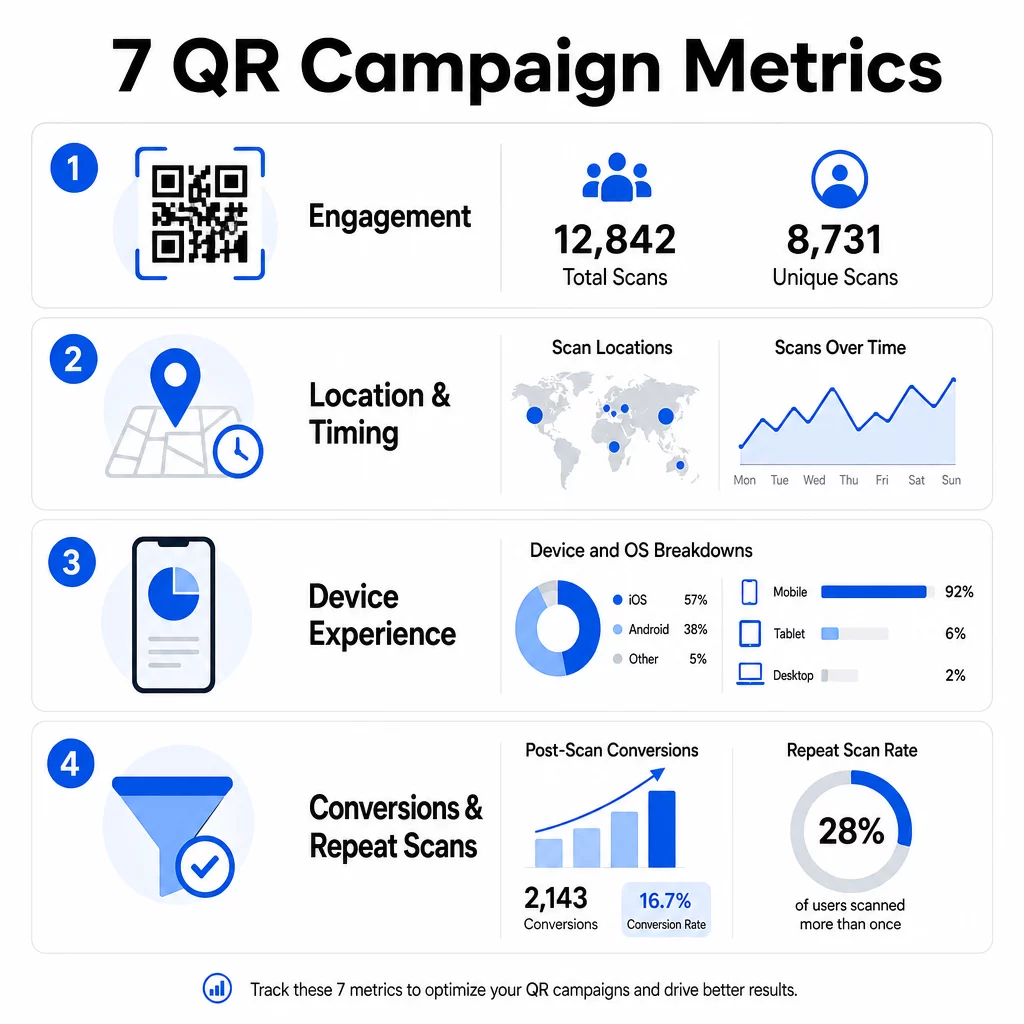
1. Total Scans
Total scans count every interaction with your QR code, including multiple scans by the same person. This is your baseline engagement metric – it tells you whether your placement is visible and compelling enough to prompt action.
Scan rates vary significantly by context:
- Print ads typically see scan rates of 1–3%
- Product packaging tends to perform at 2–5%
- In-store displays often generate 5–10%
- Event materials can reach 10–20%
A spike in total scans after a campaign launch is a positive signal, but it’s worth noting that 70% of lifetime scans typically happen within the first 30 days. A strong rollout matters. A clear call-to-action like “Scan for 10% off” drives significantly more early scans than a code placed without context.
For placement, position QR codes at eye level – roughly 4 to 5 feet high – and ensure they’re at least 1 inch in size for reliable scanning. Total scans give you reach; the metrics below tell you what to do with it.
Track Your QR Campaigns in Real Time See total scans, unique visitors, and geographic trends as they happen. Explore the QR Code Analytics & Tracking features to start measuring what matters.
2. Unique Scans
Unique scans filter out repeat interactions, counting only distinct devices or users. The gap between total and unique scans is one of the most informative ratios in your analytics.
If you have 10,000 total scans and 8,000 unique scans, 20% of your interactions are return visits. Whether that’s good or bad depends on your goal. For a loyalty program or digital menu, repeat scans are the point. For an awareness campaign designed to reach new people, a low unique scan count signals that you’re not expanding your audience.
Dynamic QR codes are required for unique scan tracking. Platforms use device-level identifiers or IP-based signals to distinguish individual users while keeping data anonymous. This distinction also matters operationally – if you’re syncing scan data to a CRM, unique scans prevent duplicate records and inflated lead counts.
A practical signal: users who scan the same code twice within 48 hours often show higher purchase intent, making them a useful segment for follow-up targeting or lead scoring.
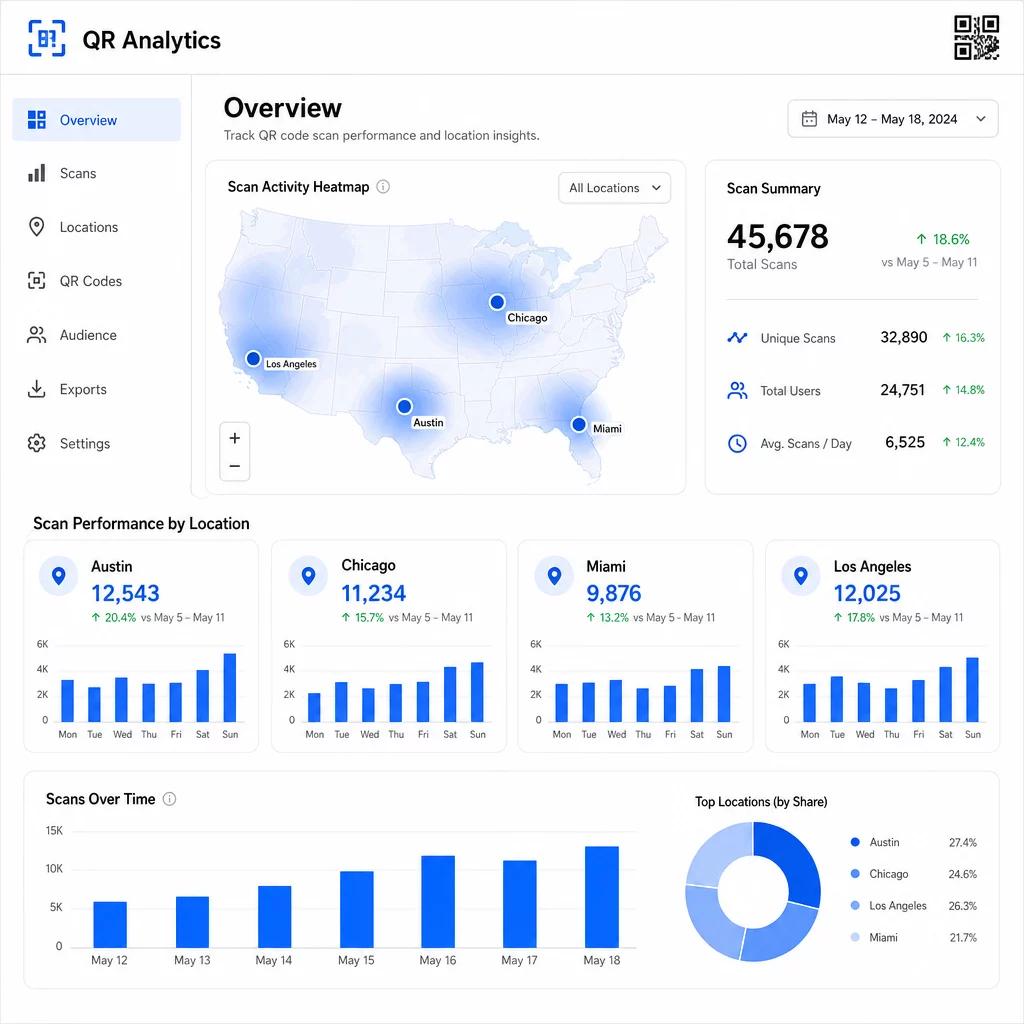
3. Scan Locations
Geographic scan data shows you exactly where your codes are being accessed, typically down to the city level. This is where location-based campaigns earn their name – and where budget decisions get much easier to justify.
Most QR analytics dashboards display location data as heatmaps or city-level breakdowns, letting you identify which placements are driving results and which regions are underperforming relative to investment. For a national campaign with even distribution, location data often reveals surprising concentration. A flyer campaign across multiple states might generate 500 scans in one mid-sized city and fewer than 100 in major markets – insight that would be invisible without location tracking.
Assigning unique QR codes to each placement is the most reliable way to isolate location performance. A single code across multiple locations gives you aggregate data; unique codes give you a direct comparison.
Location data also enables personalization. Geocélzott QR-kódok can redirect users to different landing pages based on their scan location – a grocery chain, for example, can promote hot beverages in colder regions and cold drinks where temperatures are higher, without printing separate materials.
A note on privacy: Under the California Consumer Privacy Act, precise geolocation data – defined as location within approximately a 1,850-foot radius – is classified as sensitive personal information. City-level IP-based tracking typically falls outside that threshold, but GPS-based tracking requires explicit user consent. Review your platform’s data practices and obtain proper consent before collecting granular location data.
4. Scans Over Time
Timing data reveals patterns in how your audience engages – and when. Looking at scan volume by hour, day, and week helps you understand not just how many people are scanning, but when they’re most likely to act.
General patterns vary by campaign type:
- B2B campaigns tend to peak Tuesday through Thursday, between 12:00 PM and 2:00 PM
- B2C campaigns typically see the most activity Friday through Sunday, between 6:00 PM and 8:00 PM
But local conditions matter more than general benchmarks. A coffee shop display might see spikes at 8:00 AM; an event venue QR code might peak in the 30 minutes before doors open. Tracking scan velocity – the rate of scans per hour – helps you spot these patterns and catch early signs of campaign decay, when interest begins to drop off after the initial launch period.
Timing data becomes actionable when you combine it with content control. Dinamikus QR-kódok let you update destination URLs in real time, so you can run flash sales or time-sensitive promotions that align with peak engagement windows without reprinting materials. Scheduling social or email pushes just before your peak scan hours can amplify the effect.
For ongoing placements, review timing data monthly. For active campaigns, weekly reviews are often enough to catch meaningful shifts.
5. Device and OS Breakdowns
Device data tells you what your audience is using to scan – and whether your landing page is actually working for them. By 2025, mobile devices account for approximately 96% of all QR code scans, with iOS and Android splitting the majority of that traffic.
This breakdown has direct technical implications. A landing page that loads cleanly on Safari/iOS may behave differently on Chrome/Android, particularly if it includes video, form elements, or app download prompts. Device data lets you catch these problems before they cost you conversions.
A practical example: a campaign promoting a mobile app might route iOS users directly to the Apple App Store and Android users to Google Play. That kind of smart routing – based on detected device type – removes friction and improves install rates. Pageloot’s analytics dashboard surfaces device and OS breakdowns alongside scan data, so you can make these optimizations without guesswork.
Also worth noting: 78% of users now scan QR codes using their phone’s native camera app rather than a dedicated scanner. Your content needs to work seamlessly with built-in camera apps across platforms, not just third-party apps.
If you notice high bounce rates from a specific device type, look for performance issues first – large images, unoptimized video, or forms that don’t render correctly on certain screen sizes are common culprits.
6. Post-Scan Conversions
Post-scan conversions are where engagement becomes revenue. Every metric before this one measures attention; this one measures outcomes – purchases, sign-ups, app downloads, or whatever action your campaign is designed to drive.
Common conversion benchmarks by action type:
- Social follows: 20–30%
- Email sign-ups: 15–25%
- App downloads: 10–15%
- Purchases: 2–5%
If your numbers fall significantly below these ranges, the problem is usually in the post-scan experience: a slow-loading page, an overly complex form, or a destination that doesn’t match what the QR code promised.
Setting up conversion tracking requires two things working together. First, add UTM parameters to your destination URLs – for example, `utmsource=storedisplay&utmközeg=QRcode&utmcampaign=springpromo` – so Google Analytics 4 can attribute the traffic to your QR campaign. Second, configure GA4 event tracking to record the specific actions you care about: button clicks, form submissions, video completions, or purchases. The UTM parameters guide for QR codes walks through this setup in detail.
For deeper attribution, link your QR scan data to a CRM or marketing automation platform. This lets you send personalized follow-ups based on scan behavior and track conversions across sessions, not just in the immediate post-scan window.
Calculating ROI once you have conversion data is straightforward: subtract total campaign costs (design, printing, platform fees) from revenue generated, divide by costs, and multiply by 100. A campaign that costs $500 and generates $2,000 in sales returns 300%.
Connect QR Scans to Downstream Conversions Használat QR-kód követés with UTM parameters to tie every scan to a campaign and measure what happens after the scan.
7. Repeat Scan Rate
Repeat scan rate measures how often users come back to scan a code after their first interaction. It’s a signal of content value – if users return, the experience is delivering something worth returning for.
The right repeat scan rate depends entirely on what you’re running. Loyalty programs, digital menus, and product manuals are designed for repeat interaction. Awareness campaigns and one-time promotions typically aim for broad unique reach rather than repeat engagement. Benchmarking your repeat rate against your campaign type tells you whether the behavior is expected or a sign of a problem.
| Repeat Scan Rate | What It Signals | Suggested Action |
|---|---|---|
| Magas | Content is valuable; users return intentionally | Expand to similar locations; add loyalty rewards; retarget engaged users |
| Alacsony | Content sparks one-time interest but lacks follow-up appeal | Improve landing page content; simplify user journey; test new CTAs |
| High total / low unique | Small but highly engaged audience | Focus on niche audience-building; offer personalized deals to top users |
Watch for anomalies: extremely rapid repeat scans – multiple hits within seconds – may indicate bot activity rather than genuine user behavior. If your repeat rate is high but conversions are low, the content is engaging but the conversion path has friction.
Pair repeat scan timestamps with your timing data to identify your most engaged users. Someone who scans twice within 48 hours is expressing strong intent – a useful trigger for CRM-based follow-up or personalized outreach.
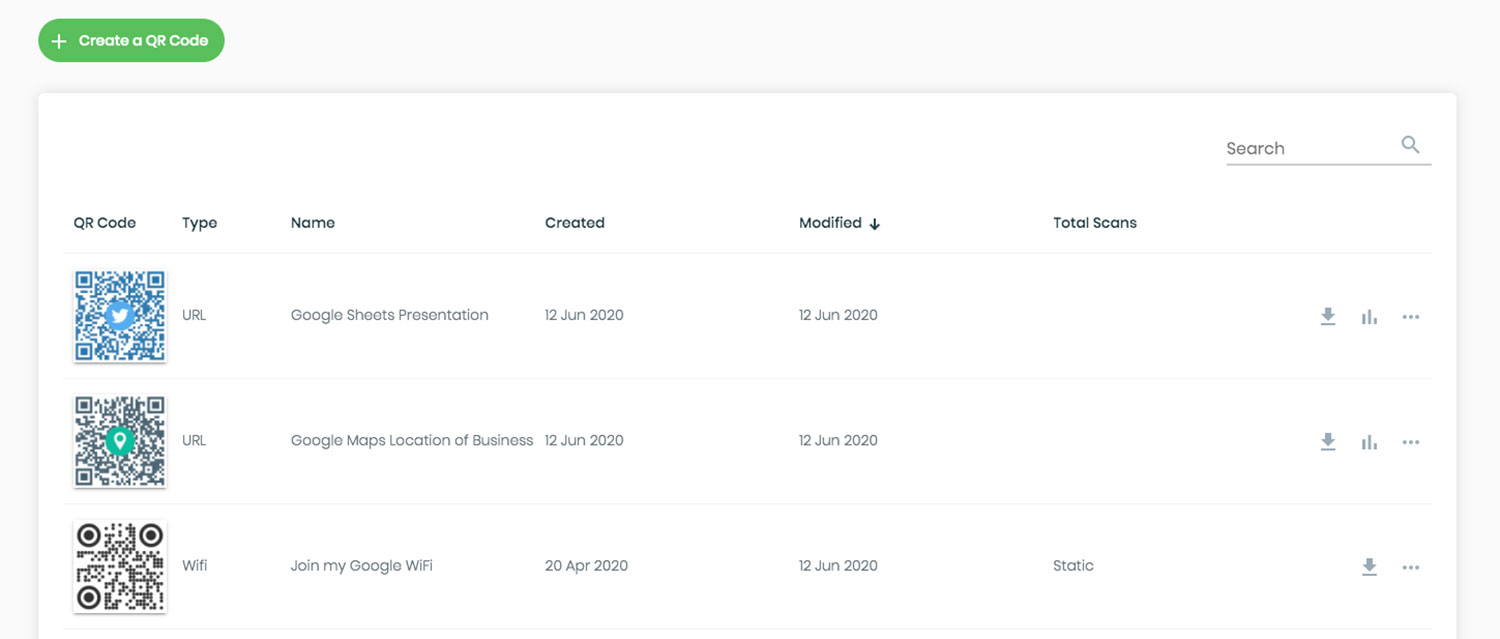
Comparing Performance Across Locations
One of the most practical uses of QR analytics is a side-by-side comparison of placements. By assigning unique codes to each location, you can directly attribute performance – not just guess at which storefront or city is working.
Here’s an example of what that comparison might look like:
| Beolvasás helye | Összes szkennelés | Egyedi szkennelések | Konverziós arány | Suggested Action |
|---|---|---|---|---|
| Austin, TX | 500 | 420 | 12% | Increase local ad spend; reinforce current offer |
| Chicago, IL | 95 | 80 | 3% | Re-evaluate placement; test stronger CTA |
| Miami, FL | 88 | 75 | 2.5% | Shift budget to higher-performing regions |
| Los Angeles, CA | 450 | 390 | 10% | Maintain strategy; use as benchmark for other urban markets |
High scan volume with low conversions often points to a post-scan experience problem. Low scans in high-traffic areas usually indicate a visibility or placement issue – try enlarging the code, repositioning it at eye level, or making the CTA more prominent.
Reviewing this comparison regularly turns raw numbers into budget decisions. For a deeper look at how to read geographic scan trends, the QR code analytics dashboard guide covers setup and interpretation in detail.
Összefoglalás
Tracking these seven metrics transforms location-based QR campaigns from a print-and-hope tactic into a measurable, optimizable system. Total and unique scans tell you about reach. Location and timing data tell you where and when to focus. Device breakdowns ensure your content actually works. Conversions connect scans to revenue. And repeat scan rate tells you whether users find enough value to come back.
The foundation of all of this is using dynamic QR codes – without them, most of these metrics simply aren’t available. Campaigns that track this data consistently can identify high-performing placements faster, fix underperforming ones before they waste budget, and build a clearer picture of offline ROI than most traditional media channels allow.
Start Tracking Your Location-Based Campaign Create dynamic QR codes, monitor real-time scan data, and compare performance by location – all from one dashboard. Try the Dinamikus QR Kód Generátorunkkal free for 14 days.
Gyakran Ismételt Kérdések
Total scans count every interaction with your QR code, including multiple scans by the same person. Unique scans count only distinct devices or users, giving you a clearer picture of how many individual people engaged with your campaign. The gap between the two tells you how much repeat engagement you’re generating.
Yes. Static QR codes embed a fixed URL and generate no analytics data. Dynamic QR codes route scans through a redirect server that logs scan time, location, device type, and other metadata. Without dynamic codes, metrics like unique scans, location data, and scan timing are not available.
Add UTM parameters to your destination URL – for example, `utmsource=storedisplay&utmmedium=qrcode&utmcampaign=campaignname` – so GA4 can attribute incoming traffic to your QR code. Then configure GA4 event tracking to record the specific actions you want to measure, such as form submissions or purchases. Dynamic QR codes make this easier because you can update or correct UTM parameters without reprinting your materials.


