
Are you struggling to measure the ROI of your flyers, posters, and direct mail campaigns? It is frustrating to invest in print media without knowing if your audience actually engages with your content or simply throws it away. This guide explains how to use QR codes to turn offline materials into trackable digital gateways that drive measurable results.
印刷物をインタラクティブメディアに変える
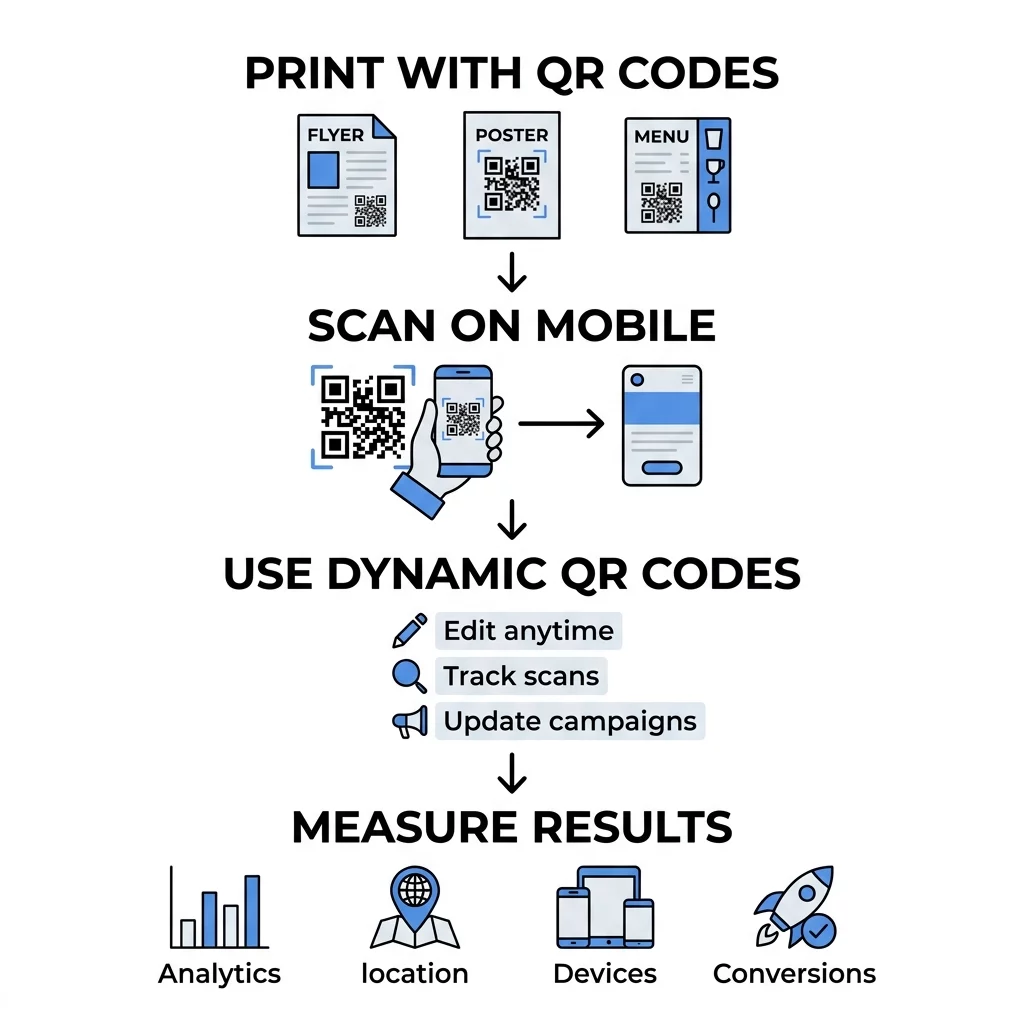
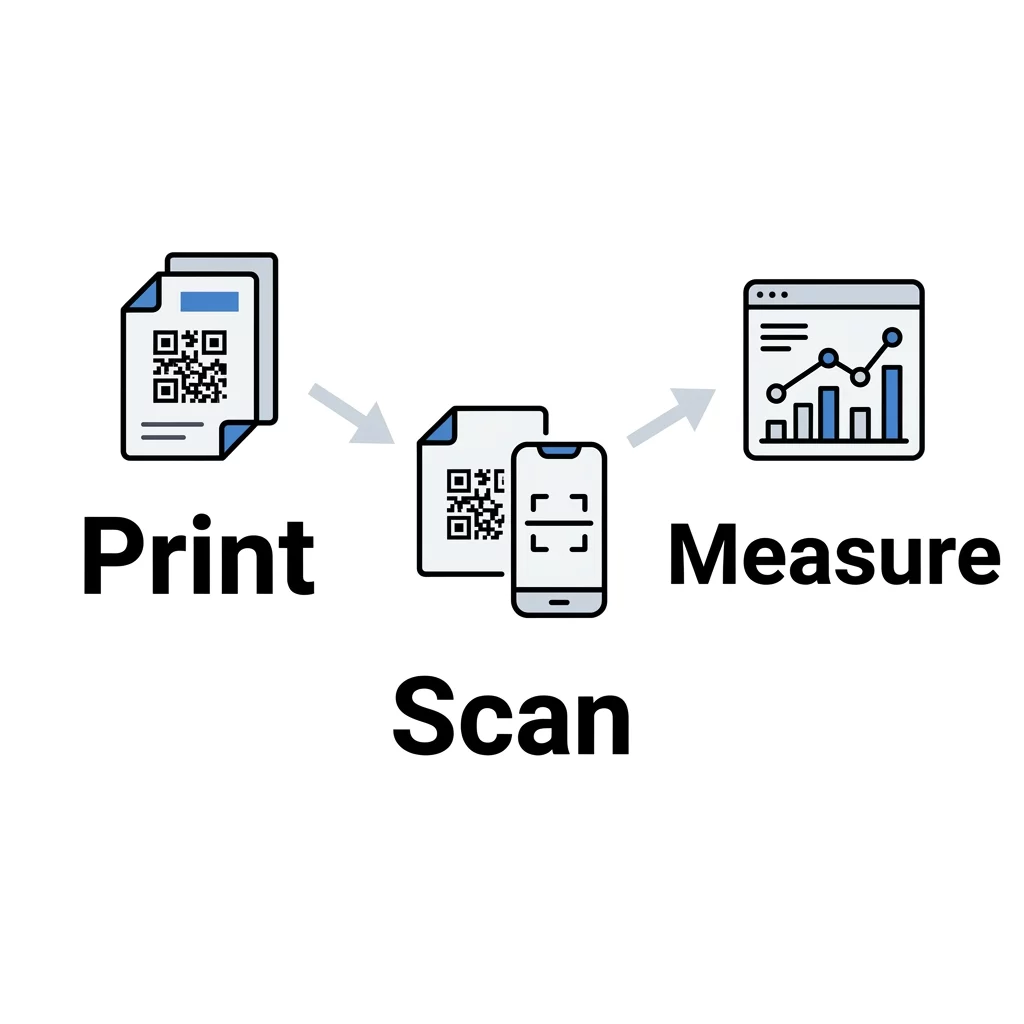
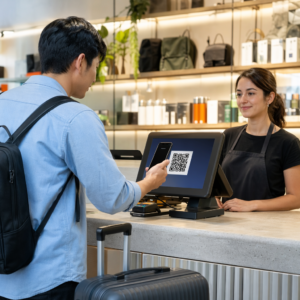
Print marketing has a major limitation: it is historically difficult to track. While digital ads offer click-through rates and conversion data, print often feels like shouting into a void. However, QR codes provide a physical link that bridges this gap. Think of the code as a portal; it takes a static image and immediately transforms it into a dynamic user journey.
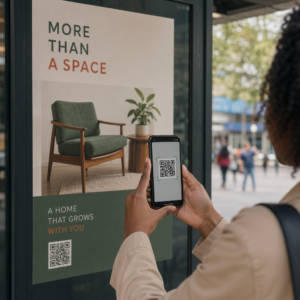
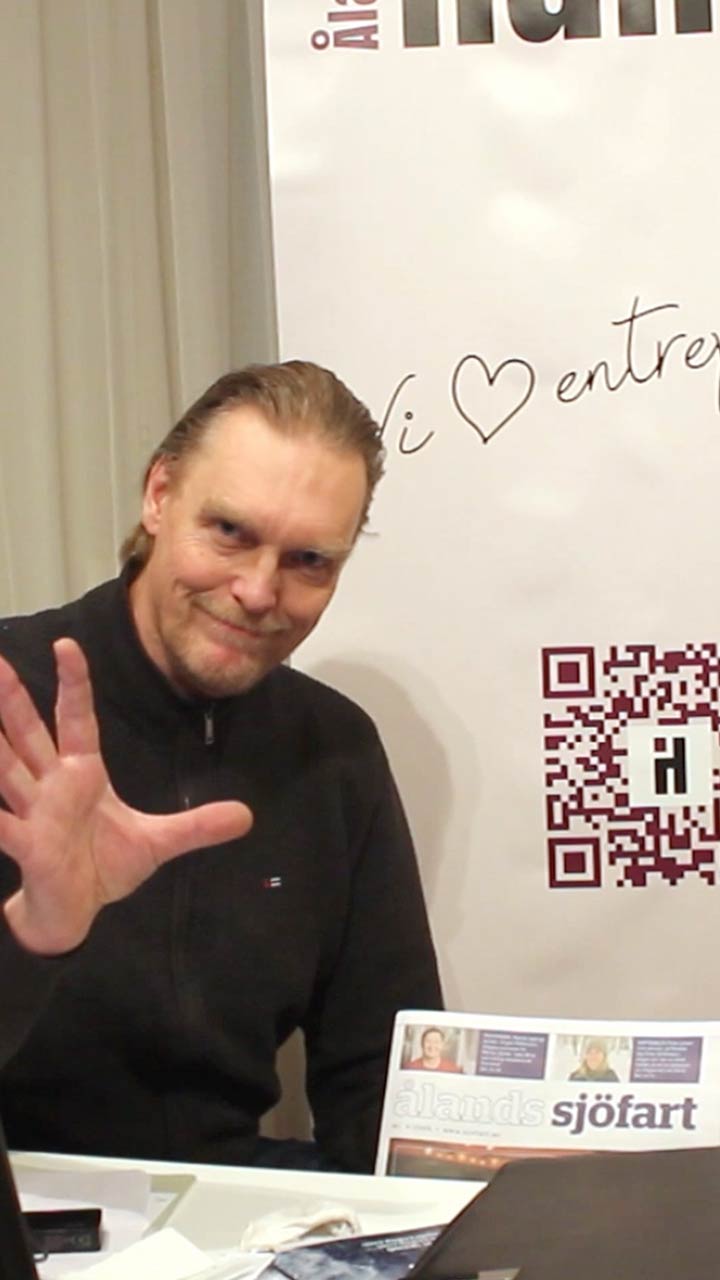
In 2022, approximately 89 million US smartphone users scanned a QR code, a number projected to exceed 100 million by 2025. By placing a code on your physical assets, you allow consumers to interact with your brand instantly. Whether they are scanning a poster at a bus stop or a flyer at an event, you are moving them from a passive viewing experience to an active digital session. This transition is essential for modern marketing because it captures the consumer’s interest at the exact moment of discovery.
Selecting the Best Digital Destinations
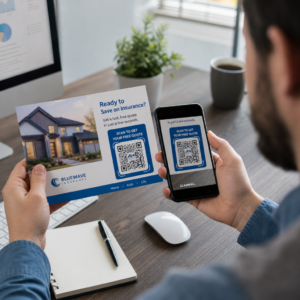
The effectiveness of your campaign depends on where you send the user. To maximize engagement, the destination must be mobile-optimized and offer immediate value. If a customer scans a code only to find a desktop-style website that is hard to read on a phone, they will likely abandon the session immediately.
- Instructional Content:を使用する。 YouTube QRコードジェネレーター to link product packaging to “how-to” videos or assembly guides, which reduces customer frustration and support calls.
- Documents and Menus: A PDF QRコードジェネレーター is ideal for restaurants or real estate agents who want to share menus or floor plans without the cost of high-volume printing.
- お客様の声: Increase response rates by using a GoogleフォームQRコードジェネレーター on receipts or in-store signage to collect instant reviews while the experience is fresh.
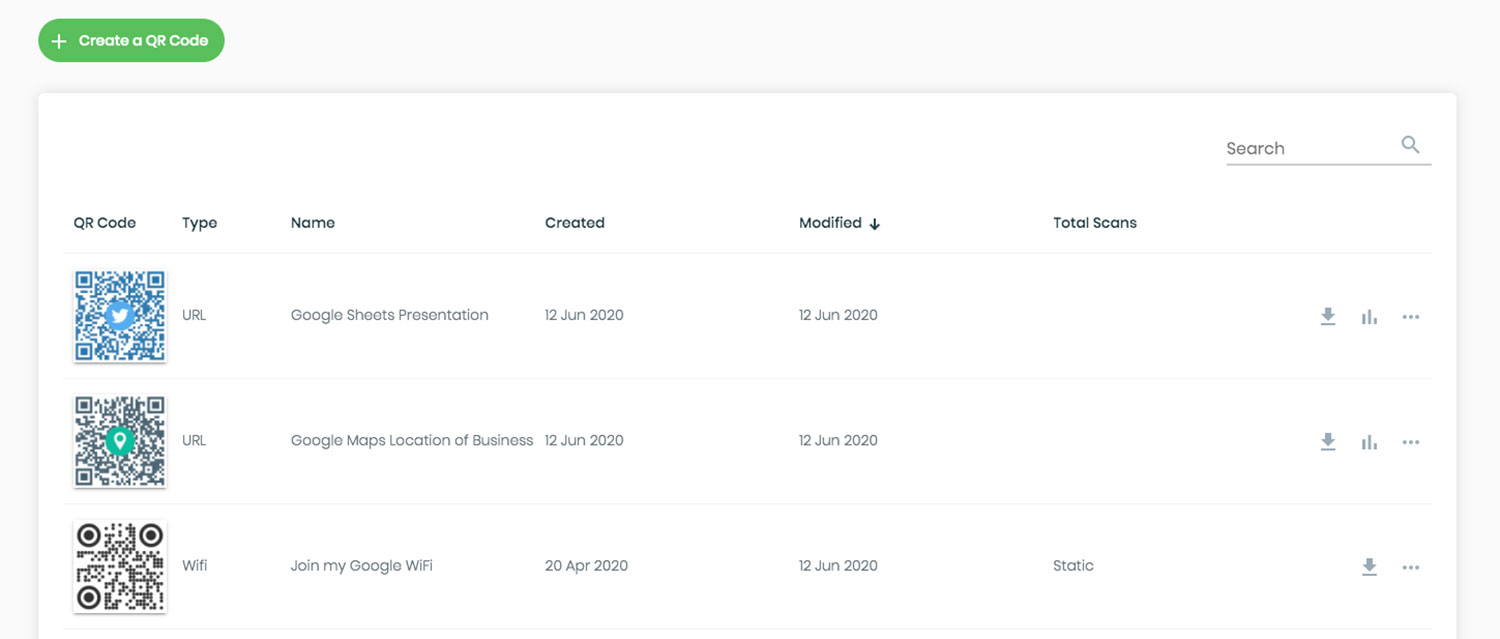
- Location Services: Help customers find your physical storefront by using a Google マップ QR コード ジェネレーター on business cards or event invitations.
Need to create a custom link for your next print campaign? Use our リンクQRコードジェネレーター to get started for free.
Why Dynamic QR Codes are Essential for Marketing
When using QR codes in print, you generally have two options: static or dynamic. For professional marketing, dynamic codes are the industry standard because they offer flexibility that static codes lack. A static code encodes data directly into the pattern, meaning the destination is permanent. If you print 10,000 flyers and then find a typo in the URL, those flyers become useless.
対照的に、, ダイナミックQRコード use a redirect URL, which allows you to change the destination even after the materials are printed. This is crucial for seasonal promotions or updating a digital menu. For example, Marriott Aruba saved over $150,000 in printing costs by switching to dynamic codes for their digital menus. Furthermore, dynamic codes are required for QRコードスキャンを追跡する in real-time, providing the data necessary to evaluate your campaign’s success.
印刷物のスキャン可能性に関する技術標準
A QR code that won’t scan is a wasted marketing opportunity. To ensure a high scan-to-completion rate, you must follow technical standards that account for different devices and lighting conditions. For most marketing materials like flyers or business cards, the code should be at least 0.8 x 0.8インチ (2 x 2 cm). You should also follow a 10:1 distance-to-size ratio; for example, a code meant to be scanned from 10 inches away needs to be at least 1 inch wide.
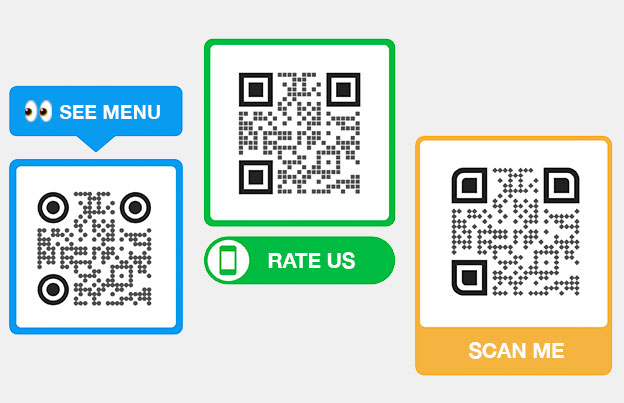
- High Contrast: Always use a dark foreground on a light background. A minimum contrast ratio of 4:1 is required for reliability, as scanners often struggle with light-colored codes or dark backgrounds.
- クワイエットゾーン: Maintain a “quiet zone” or margin around the code that is at least four modules wide. This empty space acts as a frame, helping the scanner’s software distinguish the code from surrounding text or graphics.
- 素材の選択: Avoid printing on highly reflective or glossy surfaces that create glare, as this can obscure the code’s patterns.
- Optimal Placement: Position the code at eye level, typically between 3.5 and 5.5 feet for posters, to ensure users can scan it comfortably. For more detail, see our QRコード配置ガイド.
Measuring Offline Success with Analytics
The true power of connecting print to digital lies in the data. By using QRコード分析ダッシュボード, you can move beyond guesswork and see exactly how your audience is behaving. This level of insight allows you to treat a physical flyer with the same analytical rigor as a Facebook ad or an email campaign.
監視すべき主要な指標
- 総スキャン数 vs. ユニークスキャン数: This helps you understand the total reach of your campaign versus how many individuals are engaging repeatedly.
- Geographic Data: Identify which physical locations, such as specific store branches or street corners, are generating the most interest.
- Device and Time: Reviewing which types of smartphones your audience uses and what time of day they are most active can help you optimize future placements.
To take your tracking further, integrate UTM parameters into your destination URLs. This allows you to QRコードのスキャンをリアルタイムで追跡できる within Google Analytics, providing a unified view of your marketing funnel. By following these QRコードのユーザビリティに関するベストプラクティス, you can transform static print media into a high-performing digital channel.
Ready to see how your print ads are performing? Create a trackable code with our QRコードジェネレーター and start collecting data today.
よくある質問
Yes, but only if you use a dynamic QR code. These codes use a redirect server, allowing you to update the destination URL at any time through your dashboard without changing the physical printed pattern.
The recommended minimum size for close-range scanning on items like brochures or business cards is 0.8 x 0.8 inches (2 x 2 cm). For larger formats like posters or billboards, the size must increase based on the expected scanning distance.
You should generate a unique dynamic QR code for each specific placement or version of your marketing material. By using unique names or adding specific UTM parameters to each code, your analytics will show exactly which physical location is driving the most traffic.
Bridging the gap between physical and digital touchpoints provides the data necessary to justify and optimize your marketing budget. If you are ready to start measuring your offline engagement, sign up for a free trial of the Pageloot platform to create, manage, and track your first dynamic campaign.


