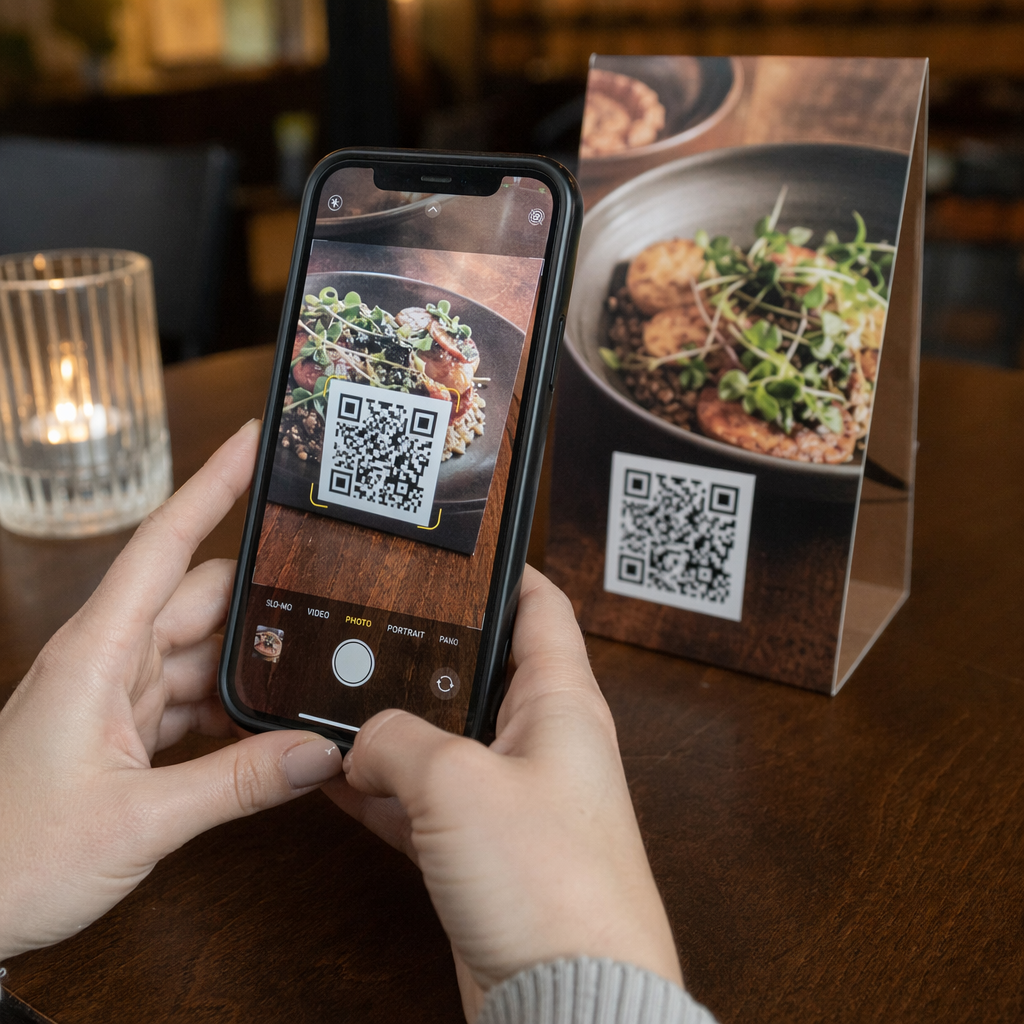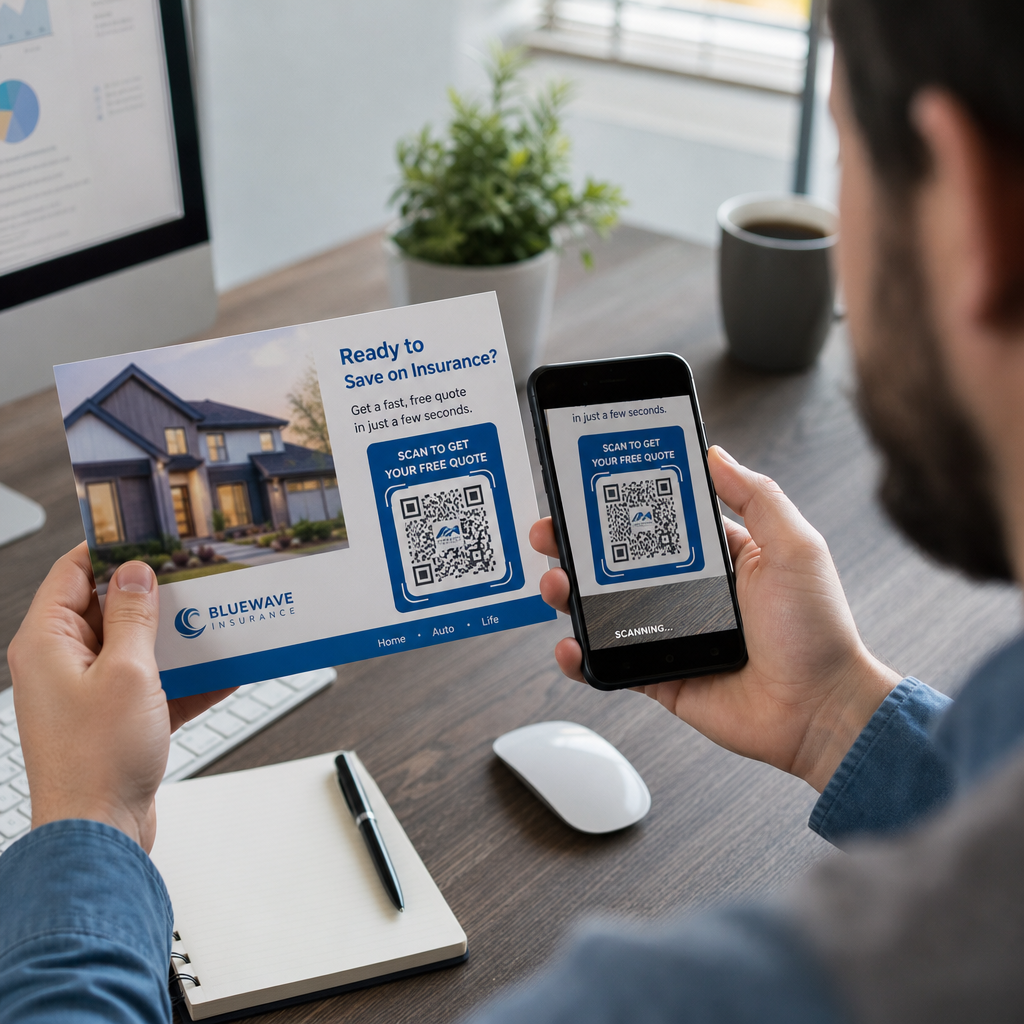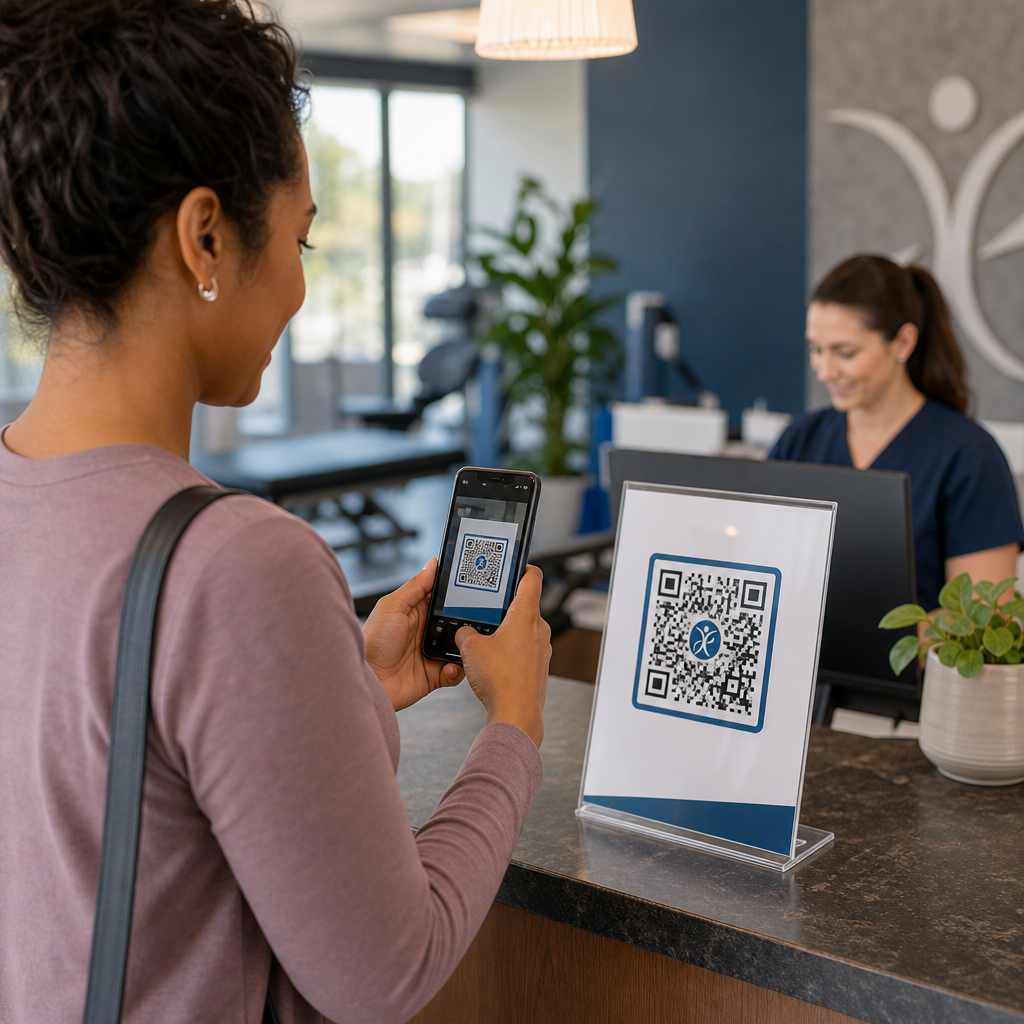
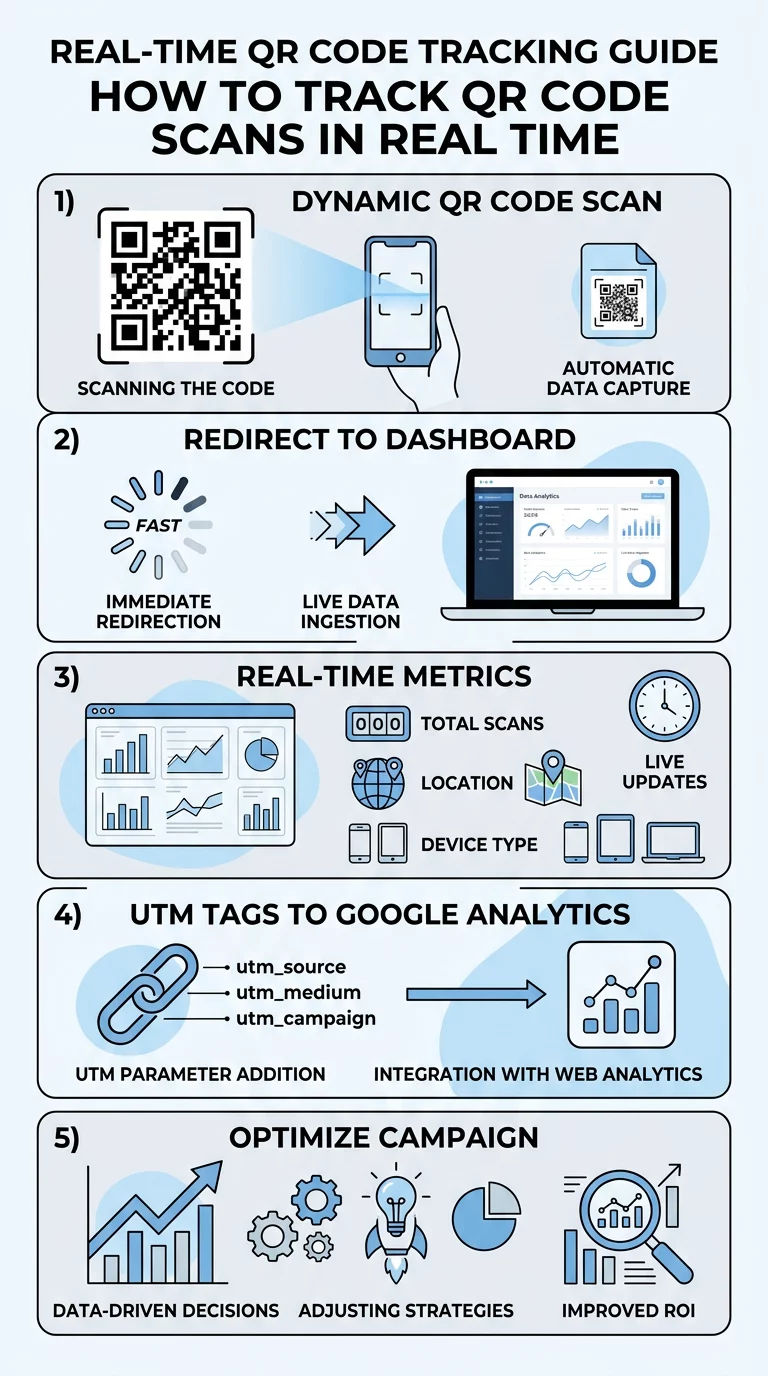
Are you launching print campaigns without knowing which physical touchpoints actually drive digital traffic? Running campaigns without performance data leaves you guessing which flyers, posters, or packaging justify your marketing spend. This guide demonstrates how to set up real-time tracking to monitor scan counts, audience locations, and device types to evaluate campaign performance.
The Technical Difference: Dynamic vs. Static QR Codes
The first step in setting up campaign tracking is selecting the correct technical infrastructure. While static and dynamic codes look identical visually, their internal functionality works in opposite ways.
Static codes store your final destination directly within the pixel pattern itself. Because a mobile device decodes the data locally and connects directly to the final resource without contacting an intermediary server, static QR codes cannot log scan analytics or provide performance metrics.
Dynamic codes instead store a short redirect link. When a customer scans the physical asset, the scanning device routes through an analytics server before redirecting to the destination page. This split-second redirect allows the management system to log key data points before sending the visitor onward. This routing mechanism also lets you change destination URLs or files after printing without needing to regenerate or reprint the physical code graphics.
How to Set Up a Trackable Dynamic QR Code
Creating a trackable campaign involves generating a dynamic asset, configuring your tracking parameters, and validating readability prior to distribution.
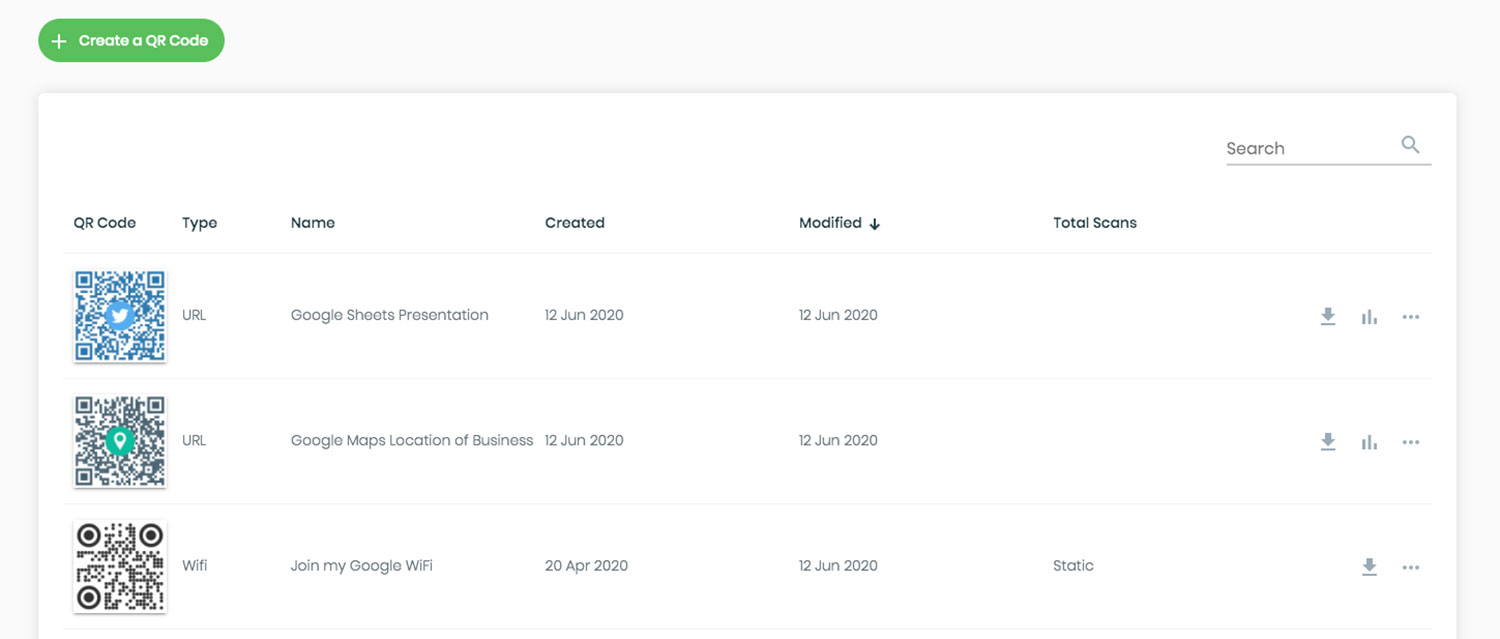
- Select your dynamic code configuration: Open a Dynamický QR kód and choose the asset type that matches your campaign goals, such as a website link, digital document, or landing page.
- Attach attribution tags: Enter your destination URL and attach standardized tracking tags to ensure your web analytics platform can identify incoming offline visits.
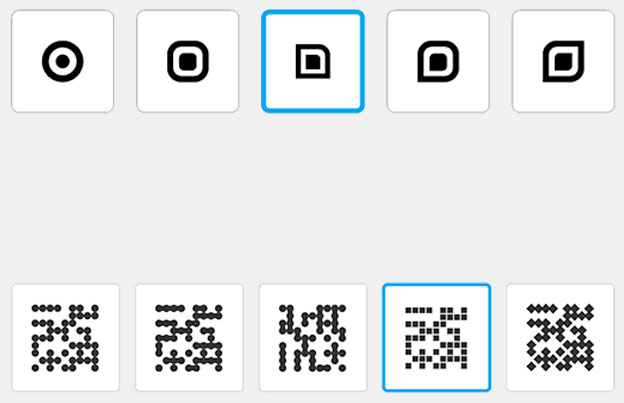
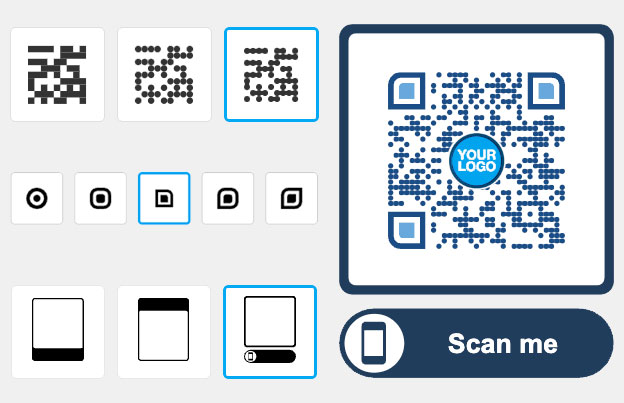
- Customize your branding: Adjust framing, add high-contrast brand colors, and incorporate your logo to establish recognition while keeping the scanning pattern legible.
- Download print-ready vector formats: Export the completed design in high-resolution vector formats such as SVG, EPS, or PDF to avoid pixelation during printing.
- Test before print production: Scan the physical proof using a smartphone camera or an online Čtečka QR kódů to verify redirect speed, parameter pass-through, and mobile rendering.
Monitorujte svou kampaň v reálném čase Chcete přesně vidět, kde a kdy vaši zákazníci skenují vaše materiály? Použijte Dynamický QR kód k vytvoření sledovatelných kódů a přístupu k plnému výkonnostnímu panelu ještě dnes.
Key Scan Metrics in an Analytics Dashboard
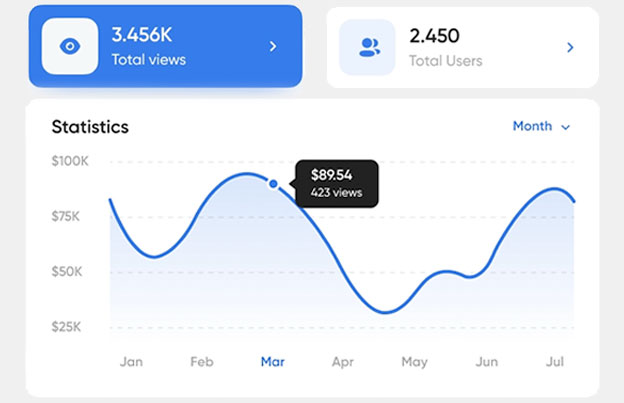
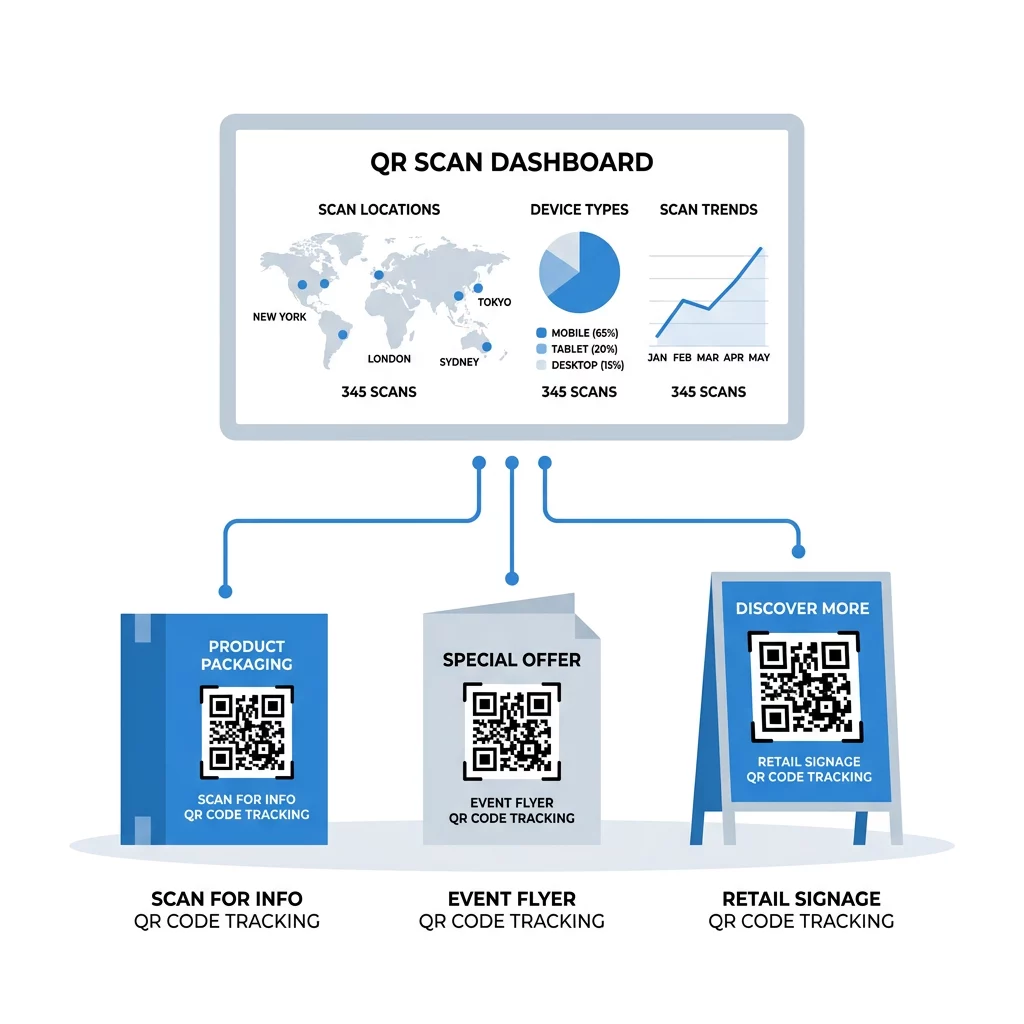
When your campaign launches, a real-time analytics dashboard aggregates raw scans into actionable performance categories.
- Total scans versus unique scans: Total scans record every scan event, while unique scans filter repeated interactions from the same device to reveal your true audience reach.
- Geographic location: Dashboards use IP geolocation to estimate country- and city-level activity, helping you verify which regional distributions, event booths, or direct-mail zones generate response.
- Device operating systems: Tracking records whether visitors scan using iOS, Android, or desktop platforms so you can optimize destination mobile layouts for your actual visitors.
- Scan distribution over time: Real-time time stamps show hourly and daily spikes, letting you pinpoint peak customer engagement windows.
For teams running multi-location or enterprise campaigns, Pageloot’s pricing details the plan tiers required for extended analytics history, multi-user access, and CSV data exports.
Connecting Print Scans to Google Analytics 4
Scan-level tracking records when a physical code is engaged, but measuring downstream user actions requires web analytics integration. You can connect these systems by configuring parametrů UTM pro QR kódy directly inside the destination URL.
Construct your URL with descriptive, lowercase parameters to organize traffic attribution within Google Analytics 4 (GA4):
- `utmsource`: Identifies the physical channel or print medium, such as `storedisplay` or `mailer`.
- `utmmedium`: Identifies the mechanism, which should remain standardized as `qrcode`.
- `utmcampaign`: Specifies the marketing initiative, such as `springlaunch_2026`.
- `utm_content`: Separates distinct placements or creative designs to enable split testing.
If any UTM parameter is present, GA4 derives all traffic-source dimensions exclusively from those tags. To maintain clean acquisition records, provide complete parameters (`utmsource`, `utmmedium`, `utmcampaign`, `utmid`, and `utmsourceplatform`) and URL-encode any special characters. Once traffic reaches your site, view incoming scan sessions under GA4’s Traffic Acquisition report.
Distinguishing Scans, Sessions, and Conversions
Proving marketing return requires treating offline interactions as a step-by-step conversion funnel rather than treating individual metrics as interchangeable values.
| Funnel Stage | Core Metric | Co měří | Strategic Value |
|---|---|---|---|
| Physical Interaction | Skenů | Scan volume, time, device, approximate location | Evaluates print visibility, physical placement, and CTA appeal |
| Digital Arrival | Website Sessions | User interactions lasting until 30 minutes of inactivity | Confirms successful redirects, mobile load speeds, and initial interest |
| Desired Action | Key Events | Completed actions like purchases, form fills, or sign-ups | Validates downstream interest and messaging alignment |
| Financial Outcome | Return on Investment | Profit attributable to campaign minus costs, divided by spend | Proves overall campaign profitability and guides budget allocation |
A recorded scan does not guarantee that a visitor waited for your website to finish loading. Evaluating scans alongside GA4 sessions and key events lets you isolate whether drop-offs stem from poor mobile performance or weak post-scan landing page messaging.
Understanding Geolocation and Privacy Considerations
Tracking geographic performance requires balancing analytical insight with user privacy standards.
Standard scan analytics rely on IP geolocation rather than continuous GPS tracking. Country-level geolocation provides high accuracy, while city-level matching typically reaches 70% to 90% accuracy. Corporate networks, cellular routing hubs, and VPNs can route traffic through distant servers, which introduces location variance. Precise GPS coordinates require affirmative user permission via a browser prompt before the browser shares device-level positioning.
Privacy compliance depends on the data collected, applicable regulations, and whether information can be linked to individual identities. Under guidelines from regulatory bodies like the FTC, sensitive geolocation data should not be disclosed or shared without clear affirmative consent. To minimize compliance risk, use privacy-focused analytics that aggregate IP data without collecting unnecessary personally identifiable information.
Často kladené otázky
You can only track a printed QR code if it was originally created as a dynamic QR code. Dynamic codes route through an analytics server, which logs scans and allows you to update destination links at any time. Static codes permanently encode data directly into the design pattern and cannot be modified or tracked once printed.
Scans and sessions measure separate actions. A scan logs a physical device reading the code, while a GA4 session measures active browsing engagement on your website. Discrepancies occur when users scan a code but close their mobile browser before the site finishes loading, or when network blockers prevent analytics scripts from running.
No mobile app is required. Real-time scan dashboards are accessible through web-based platforms across mobile, tablet, and desktop browsers. Scan events appear in your management dashboard moments after a user scans the physical code.