Are you trying to make the case for QR codes in your next campaign but need the numbers to back it up? Without solid data, budget decisions and channel choices feel like guesswork. This page compiles the most relevant QR code marketing statistics, usage benchmarks, and trend data to help you plan smarter.
QR Code Adoption Among Marketers Is Near-Universal
The most striking headline from recent industry surveys: QR codes are no longer a niche tactic. According to 2025 data, over 90% of marketers report using QR codes in their campaigns. That figure signals a technology shift from “emerging” to standard practice.
The growth trajectory reinforces this point clearly:
- 94% of marketers increased their QR code usage in the previous 12 months
- 86% plan to increase usage further in the next 12 months
- 88% believe consumer sentiment toward QR codes has become more positive, with 40% describing the shift as significantly more positive
These numbers suggest that adoption isn’t just growing – it’s accelerating. Marketers who aren’t yet using QR codes are increasingly in the minority.
How Many Americans Are Scanning QR Codes?
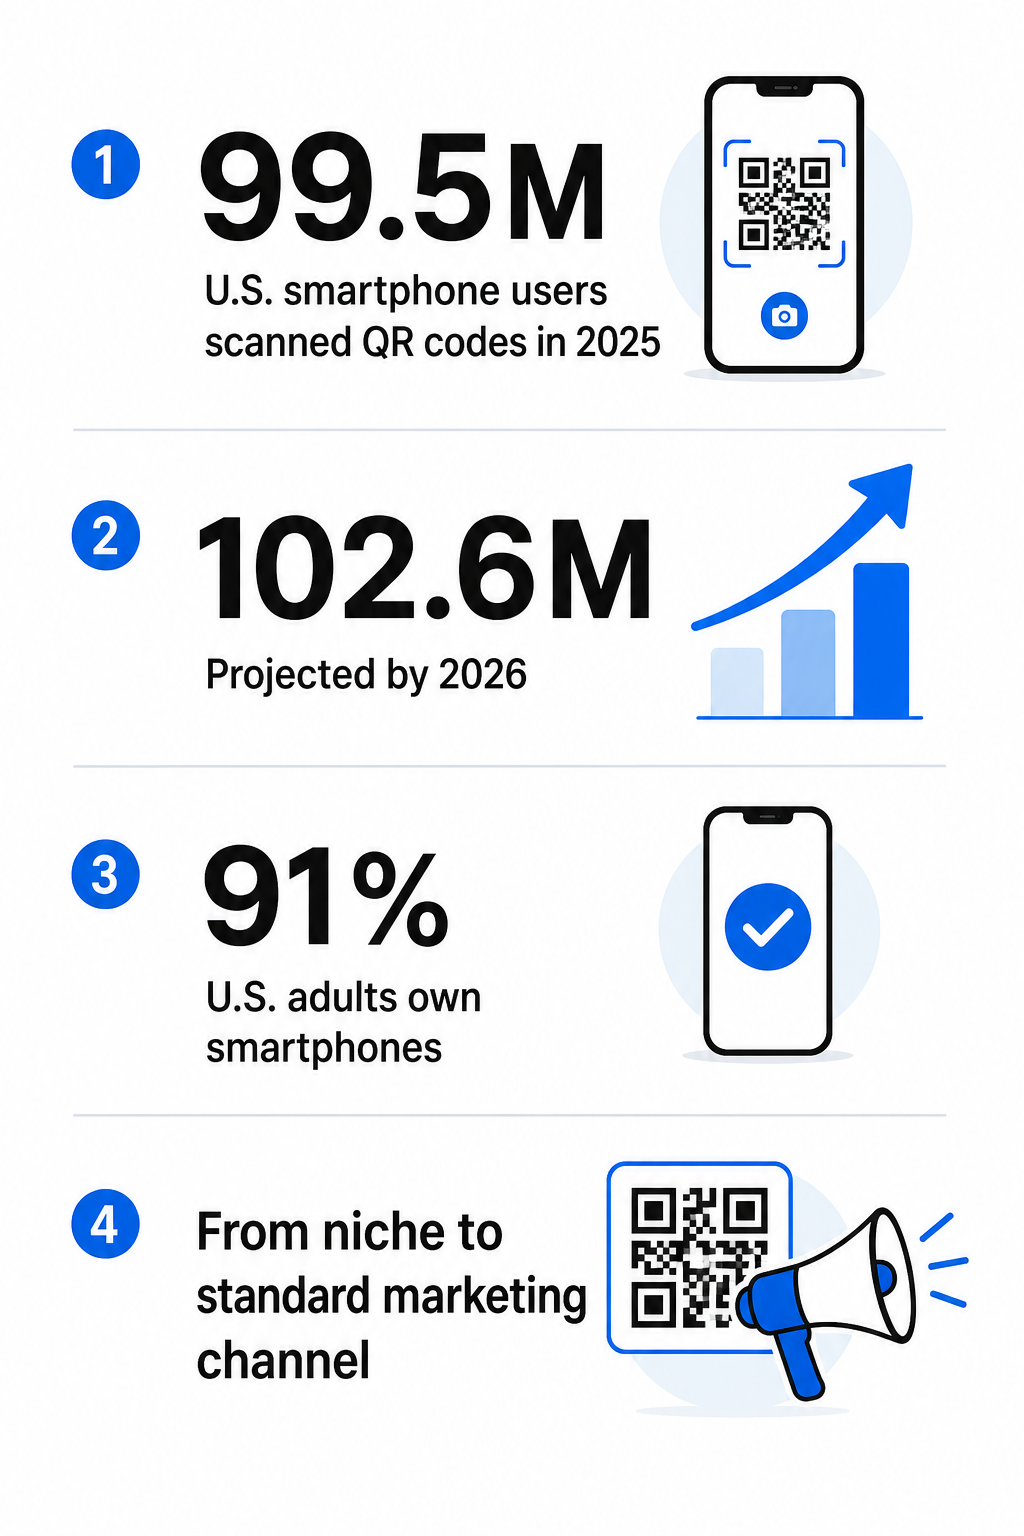
Consumer-side adoption tells an equally compelling story. In 2025, 99.5 million U.S. smartphone users scanned a QR code, with projections reaching 102.6 million by 2026 – roughly one in three Americans.
For context on how fast this has grown:
- In 2022, approximately 89 million U.S. smartphone users scanned QR codes
- That represented roughly a 26% increase over 2020 scan volumes
- The 100 million user threshold was crossed right on schedule with earlier projections
Smartphone penetration further explains why QR codes have such wide reach. According to Pew Research Center, 91% of U.S. adults now own a smartphone, up from just 35% in 2011. That means your QR code campaigns can theoretically reach the overwhelming majority of American consumers.
Additional consumer behavior data shows strong engagement:
- 91% of people surveyed had scanned a QR code
- 86% had scanned one within the last month
- 89% said they wanted to see more QR code usage
This isn’t passive awareness – these are active users who scan regularly.
Who Is Scanning? Demographics and Frequency
Understanding your audience helps you prioritize where and how to deploy QR codes. The data consistently points to younger adults as the heaviest users:
- 57% of 18–34-year-olds use QR codes frequently
- 49% of Gen Z และ 51% of millennials scan QR codes at least once a week
- The largest group of non-users is concentrated in the 62–75 age range, representing close to 40% of non-scanners
Most U.S. QR code users scan several times per month, and about one in five scan weekly. This frequency suggests that consumers who engage with QR codes aren’t doing so reluctantly – they’ve built it into their regular behavior.
If your campaigns target younger consumers, QR codes are particularly well-positioned as a channel. If your audience skews older, adding clear instructions and strong visual cues near the code can help bridge the familiarity gap. You can find specific placement and design guidance in this overview of how to use QR codes effectively in your marketing.
Where Are Marketers Deploying QR Codes?
Survey data from 2025 shows the most common placements for marketer-deployed QR codes:
| การจัดวาง | Share of Marketers Using It |
|---|---|
| เหตุการณ์ที่เกิดขึ้น | 43% |
| พิมพ์โฆษณา | 40% |
| In-store displays | 40% |
These three channels dominate because they share a common dynamic: a captive audience with time and physical proximity to scan. Events, in particular, combine strong intent with a natural moment of engagement.
Beyond these top three, packaging and email are also commonly cited. The key pattern is that QR codes are most effective where there’s a clear reason to scan and where the physical environment makes scanning convenient.
For a channel-by-channel look at how different industries are deploying QR codes, see the QR code scanning trends by industry breakdown.
QR Codes as a First-Party Data Tool
As third-party cookies continue to decline in reliability and regulatory acceptance, QR codes have emerged as a direct path to first-party data collection. The numbers are striking: 95% of businesses now use QR codes to capture first-party data.
When a user scans a QR code and fills out a form, registers for an event, or signs up for a loyalty program, that interaction is attributable, opted-in, and directly tied to a specific campaign touchpoint. Unlike cookie-based tracking, QR scan data doesn’t depend on browser settings or ad-blocking behavior.
This makes QR codes particularly valuable for:
- Building email and SMS lists from print materials
- Connecting in-store engagement to digital profiles
- Attributing offline touchpoints to online conversions
QR codes also work well alongside UTM parameters, giving you an additional layer of campaign attribution inside Google Analytics. This guide on UTM parameters for QR codes walks through how to set that up in practice.
QR Code Scan Rate Benchmarks
Scan rate – sometimes called scan-through rate – measures what percentage of people who see a QR code actually scan it. The formula is straightforward:
Scan rate = (Scans ÷ Impressions) × 100
So if 200 people scan a code that was seen by 4,000 people, the scan rate is 5%.
Realistic benchmarks vary significantly by placement and context. On product packaging, for example, well-run campaigns typically see scan-through rates between 4% and 12%, meaning roughly 5 in 100 people who see the code will scan it.
Factors that move scan rates higher:
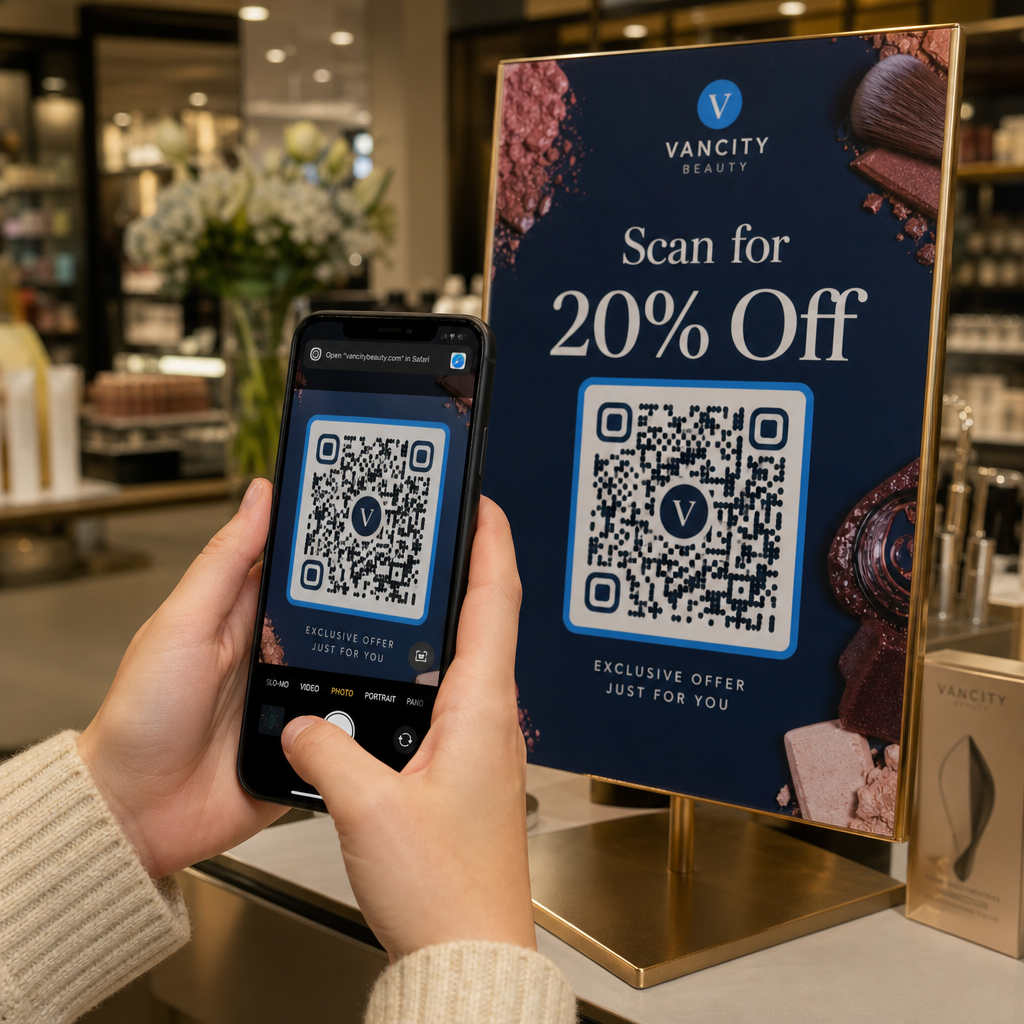
- Clear call-to-action text near the code, such as “Scan for 20% off”
- High-contrast, correctly sized code (minimum 0.8 × 0.8 inches for print)
- A compelling, obvious reason to scan
- Placement at natural eye level and attention points
Adding a QR code to a direct mail piece can also produce measurable lifts. One academic study found that including a QR code in survey invitation letters increased the overall response rate from 7.00% to 8.31% – a meaningful improvement without any change to the underlying offer.
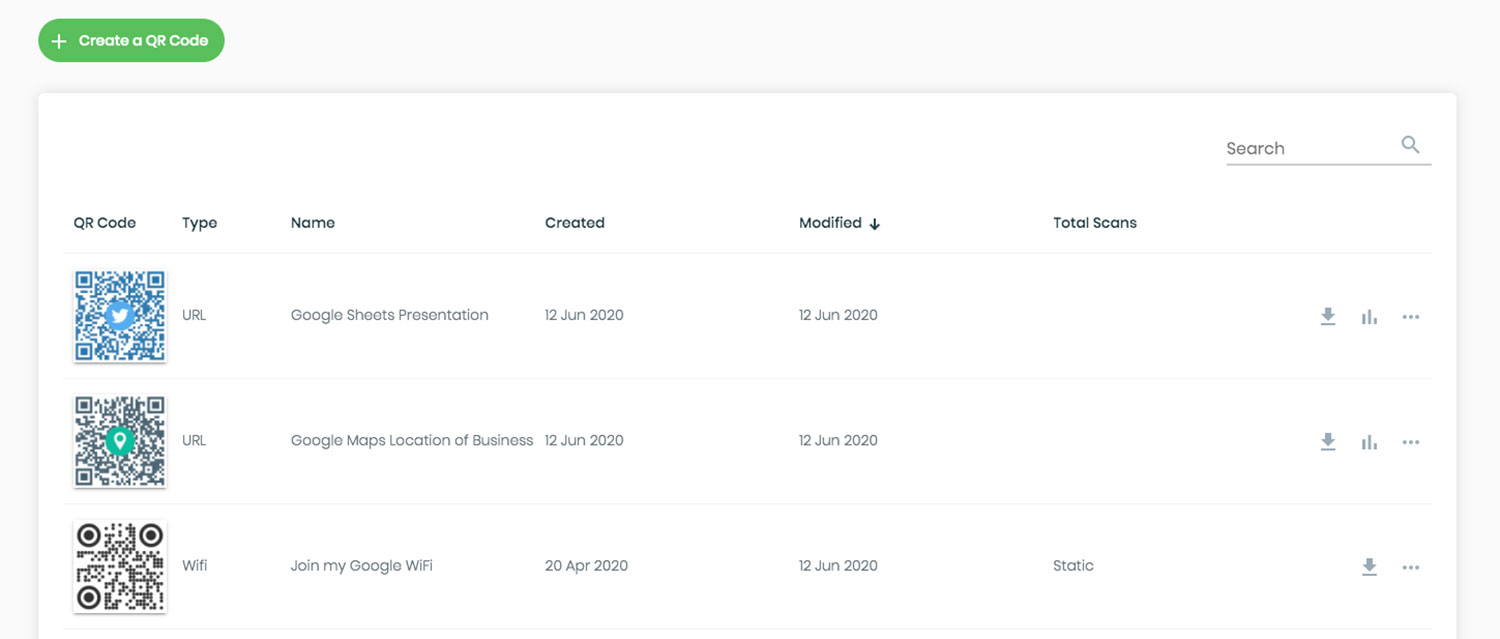
See How Your QR Codes Are Actually Performing Track scan volume, placement performance, device types, and geographic data in one place. Explore Pageloot’s QR code analytics feature to turn raw scan data into campaign insights.
QR Code Conversion Rate Benchmarks
Conversion rate is distinct from scan rate. Where scan rate measures who scans, conversion rate measures what percentage of those scanners complete a target action.
Conversion rate = (Completions ÷ Unique Scans) × 100
For example, 300 scans leading to 87 form completions yields a 29% conversion rate.
Benchmarks vary considerably based on the friction involved in the action:
| Action Type | Typical Post-Scan Conversion Rate |
|---|---|
| WiFi login | 60–85% |
| Menu access | 55–75% |
| Contact card save | 25–45% |
| Event registration or check-in | 20–40% |
| Product feedback form | 15–30% |
| Lead capture form | 10–25% |
| App install | 8–18% |
| Newsletter or email opt-in | 5–15% |
| Direct product purchase | 3–12% |
The pattern is consistent: lower-friction actions convert at much higher rates. WiFi login converts easily because the user has an immediate, obvious need. A purchase requires significantly more intent.
สำหรับ marketing conversions – form fills, opt-ins, purchases – a 10–25% post-scan conversion rate is a realistic working benchmark. Campaigns below 5% typically signal a mismatch between the promise on the physical material and the experience after scanning. Campaigns above 25% usually benefit from strong incentives or a highly motivated audience.
In trade show or in-store lead capture contexts, a 10–20% unique-scan-to-form-submission rate is a reasonable expectation when the form is short and the value exchange is clearly communicated.
These benchmarks are directional rather than universal – your actual results will depend on your placement, offer, audience, and landing page quality. For more on improving performance across channels, see how รหัส QR เชื่อมโยงการตลาดสิ่งพิมพ์และดิจิทัล.
QR Code Payments: A Fast-Growing Use Case
Beyond marketing campaigns, QR codes are expanding rapidly into commerce. The U.S. QR code payments market generated $2.55 billion in revenue in 2024 and is projected to reach $11.84 billion by 2033, representing a compound annual growth rate of 19.3%.
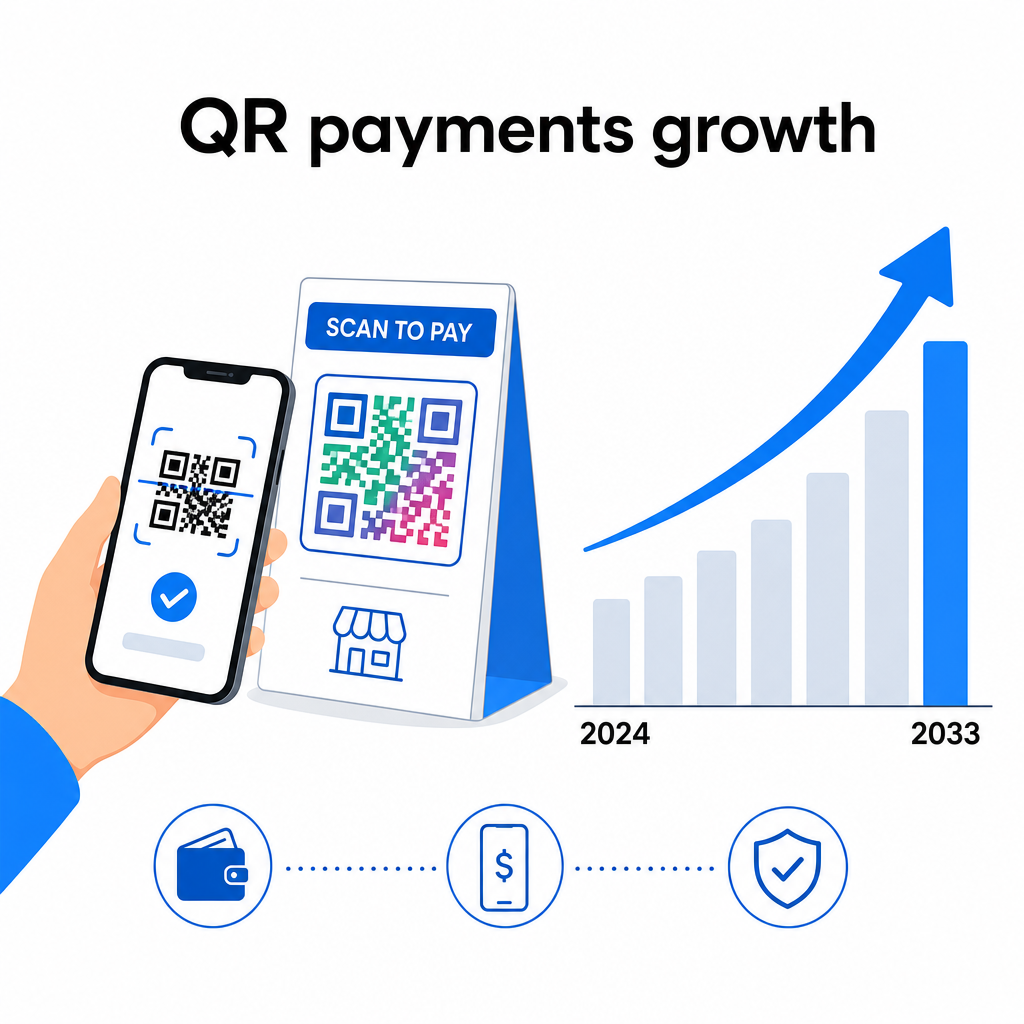
Consumer surveys confirm payment as one of the top two QR use cases in the U.S., alongside checking product information on food and beverage packaging. The Federal Reserve is also actively working on an interoperable QR code standard designed to work across payment rails, including the FedNow Service.
For marketers, this matters because it widens what a single QR code can accomplish. A code on a restaurant table, retail shelf, or event badge can now handle discovery, information delivery, and payment within a single interaction – collapsing the distance between awareness and action.
Consumer Sentiment Is Running in Your Favor
One underappreciated data point for marketers: 45% of U.S. consumers have already used QR codes in the context of a marketing or advertising campaign. That’s not passive familiarity – it’s direct, prior experience interacting with a marketer’s QR code.
Combined with the finding that 89% of consumers want to see more QR code usage, the data makes a clear case that the audience is receptive. The skepticism that followed QR codes’ earlier failed wave in the pre-smartphone era has largely dissipated. Marketers who avoided QR codes due to audience friction concerns have less reason to hold back.
The channels most associated with consumer QR engagement include food and beverage packaging, payments, and retail environments. If you operate in any of those spaces, the behavioral data strongly supports QR integration. For practical guidance on getting started, the QR codes for small business marketing guide covers the essentials without assuming a large budget or technical team.
Putting the Numbers to Work
The statistics above describe a channel that has crossed from experimental to expected. QR codes are used by nearly every marketer, scanned by roughly a third of the U.S. population, and increasingly tied to first-party data strategies that address broader privacy-driven shifts in digital marketing.
The practical takeaway: the question for most marketers is no longer whether to use QR codes, but where to place them, what to measure, and อย่างไร to iterate based on performance data. Dynamic QR codes are especially useful here – they allow you to update the destination URL without reprinting, run A/B tests on landing pages, and collect scan-level analytics across every placement.
Start Tracking QR Code Performance Across Campaigns ใช้ เครื่องสร้างคิวอาร์โค้ดแบบไดนามิก to create trackable, editable QR codes for your next campaign and get real-time data on scans, locations, and devices from day one.
For industry-specific strategies and additional guidance, explore Pageloot’s QR code solutions by industry.
คำถามที่พบบ่อย
Scan rates depend heavily on placement, design, and context. For product packaging in well-run campaigns, a scan-through rate of 4–12% is typical. For other print placements such as flyers or posters, results vary based on the strength of the call-to-action and the incentive offered. Campaigns with clear, compelling reasons to scan consistently outperform those without.
Conversion rate is calculated as completed actions divided by unique scans, multiplied by 100. To track this accurately, you need dynamic QR codes with built-in analytics, combined with a landing page that records the target action – such as a form submission, purchase, or opt-in. Adding UTM parameters lets you tie QR-driven traffic to specific campaigns inside Google Analytics. See the full guide on tracking QR code scans and analytics for a step-by-step approach.
Yes – 95% of businesses now use QR codes specifically for first-party data capture. When a user scans a code and completes a form or registration, that interaction is directly attributed to a specific physical touchpoint. Unlike cookie-based tracking, this data doesn’t rely on browser settings and is collected with clear user intent, making it more reliable and more compatible with evolving privacy standards.