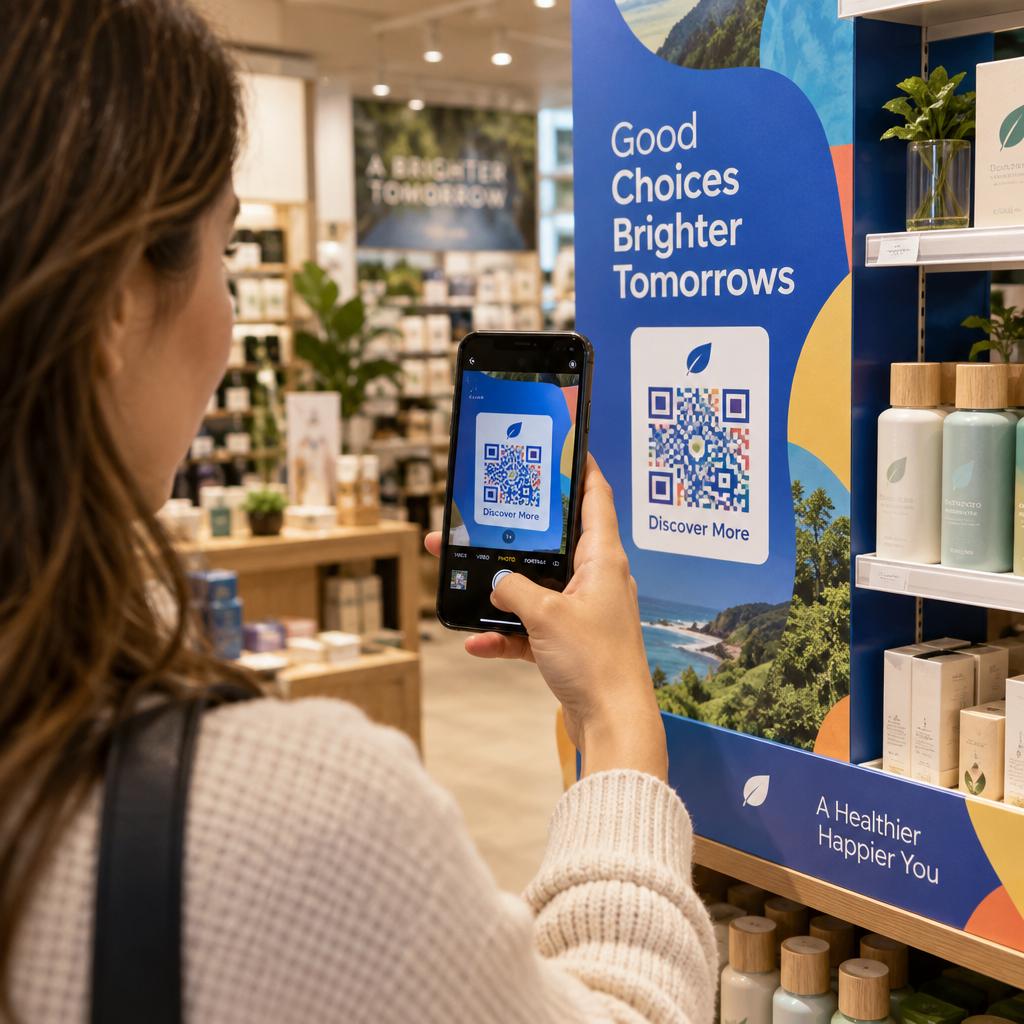
Are your physical touchpoints failing to connect customers with your digital channels? When print materials lack measurable interaction, businesses waste marketing spend and miss vital consumer engagement data. This guide examines real-world adoption benchmarks across key sectors to help you optimize your deployment strategy.
The State of QR Code Scanning Adoption
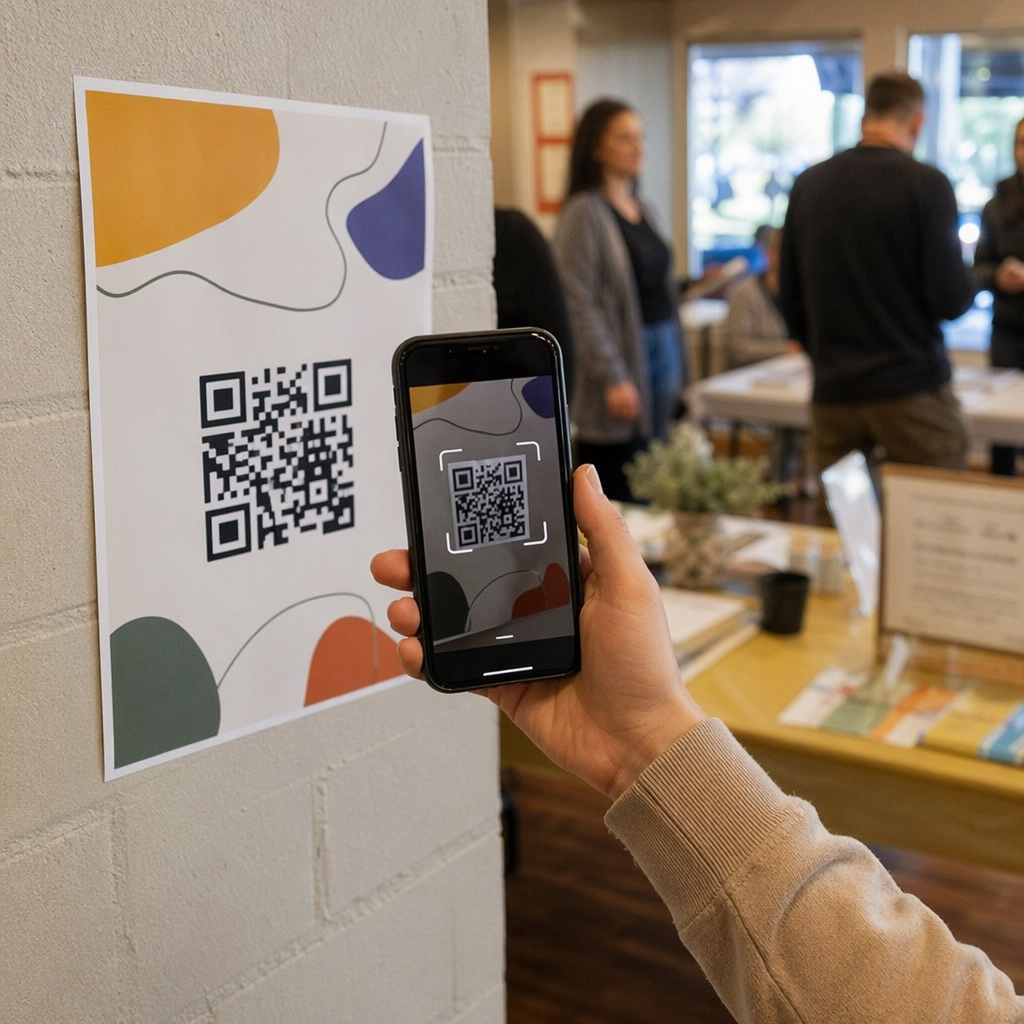
Consumer interaction with 2D barcodes has evolved into an everyday mobile habit. Research indicates that 68% of U.S. adults scan a QR code at least once a year, with engagement spiking among younger demographics. Specifically, 83% of Gen Z consumers and 81% of millennials report active QR code use, with approximately half of both groups scanning codes weekly.
This sustained adoption spans both operational interactions and promotional campaigns. Across user surveys, the most frequent scanning activities include:
- Viewing digital restaurant menus (48%)
- Downloading mobile applications (47%)
- Accessing on-pack product information (43%)
- Connecting to Wi-Fi networks (32%)
- Accessing digital event tickets (31%)
Modern smartphones recognize 2D barcodes directly through native camera apps, while dedicated tools like an online Optični bralnik QR kode allow users to decode images from web browsers and desktop screens. As friction drops, organizations across commercial and industrial sectors are tailoring deployments to meet specific operational goals.
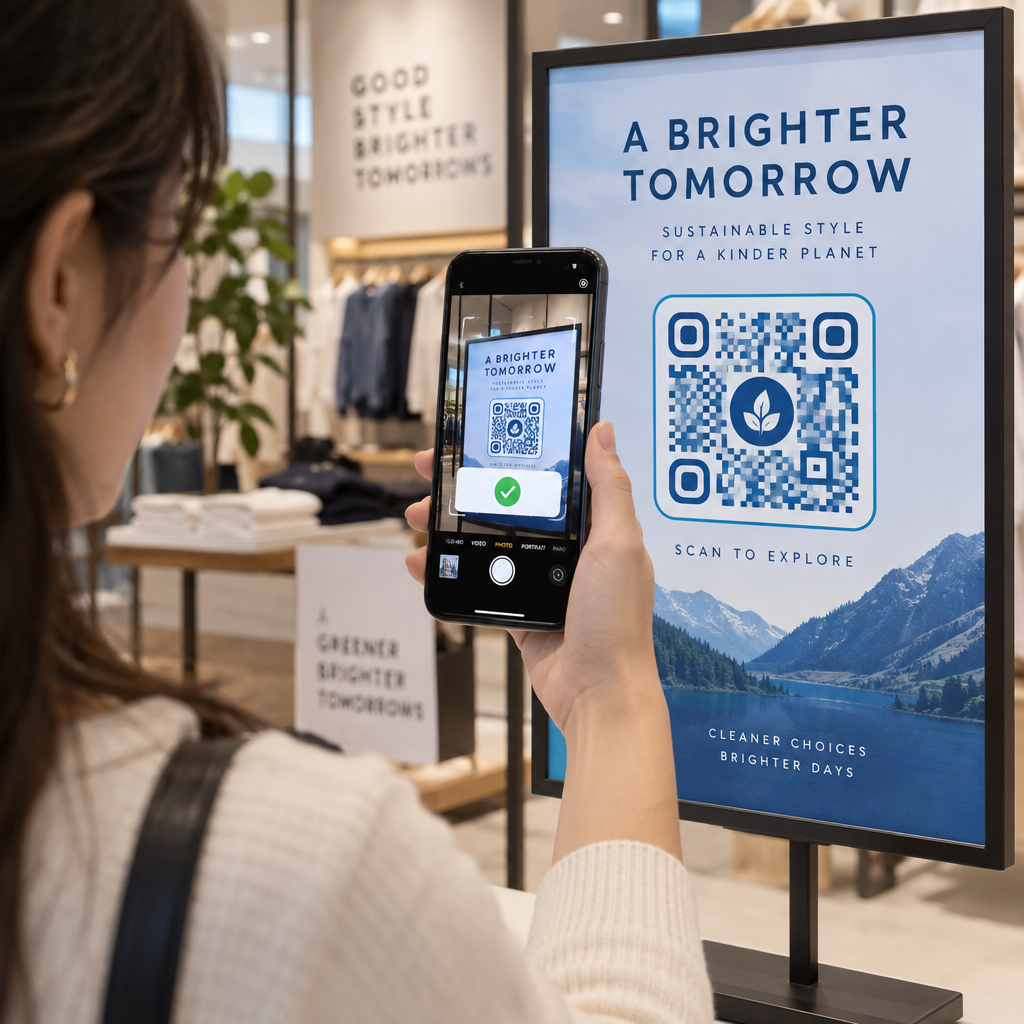
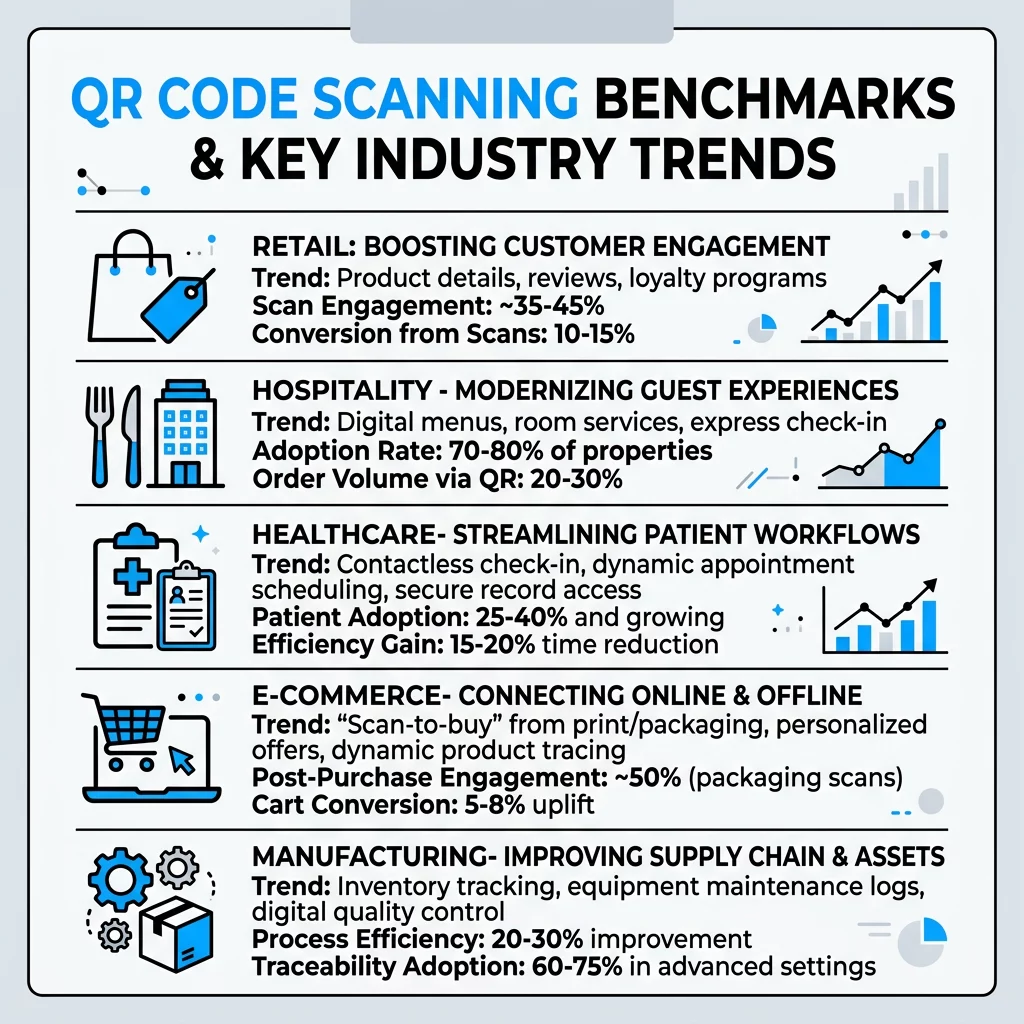
Retail: Connecting In-Store Shoppers with Digital Product Data
Retailers increasingly use scannable touchpoints to satisfy consumer demand for transparent product details. Research from GS1 US reveals that 79% of shoppers are more likely to purchase items when a scannable barcode or QR code provides desired information. Furthermore, 66% of shoppers express interest in scanning food packaging to verify freshness, ingredients, and shelf-life data.
Leading retailers implement QR codes for retailers across multiple store formats:
- Delivering detailed product transparency: Brands place codes on primary packaging to supply nutrition details, ethical sourcing histories, and styling guides that exceed physical label space.
- Expediting in-store mobile checkouts: Retail programs like Walmart Pay and Sam’s Club Scan & Go let shoppers scan products or register displays to finalize contactless transactions.
- Verifying authentic product origin: High-value consumer goods brands embed serialized codes so buyers can confirm genuine items and prevent counterfeit risks.
The broader retail sector is actively preparing for the Sunrise 2027 initiative, a transition standardizing 2D barcode scanning at point-of-sale terminals. With 82% of retailers supporting this shift away from traditional UPC barcodes, stores are adopting GS1 Digital Link standards. This single barcode format allows a product code to ring up at checkout while simultaneously directing consumer smartphones to web-based brand experiences.
Hospitality: Streamlining Menus, Ordering, and Guest Services
Hospitality venues rely on scannable codes to reduce operational overhead and elevate guest convenience. Data from the National Restaurant Association confirms that 59% of full-service patrons and 57% of limited-service customers welcome accessing menus through mobile devices. Implementing dedicated restaurant QR code solutions allows management to update menu items, prices, and allergen details instantly without reprinting paper inserts.
Lodging providers mirror this operational shift. In hotel environments, placing hotel guest service QR codes across keycards, lobby displays, and guest rooms simplifies access to amenities. For example, a documented deployment across more than 2,600 Hampton by Hilton, Tru by Hilton, and Spark by Hilton hotels partnered with Grubhub to let guests scan in-room codes for food, grocery, and convenience deliveries directly to their doors.
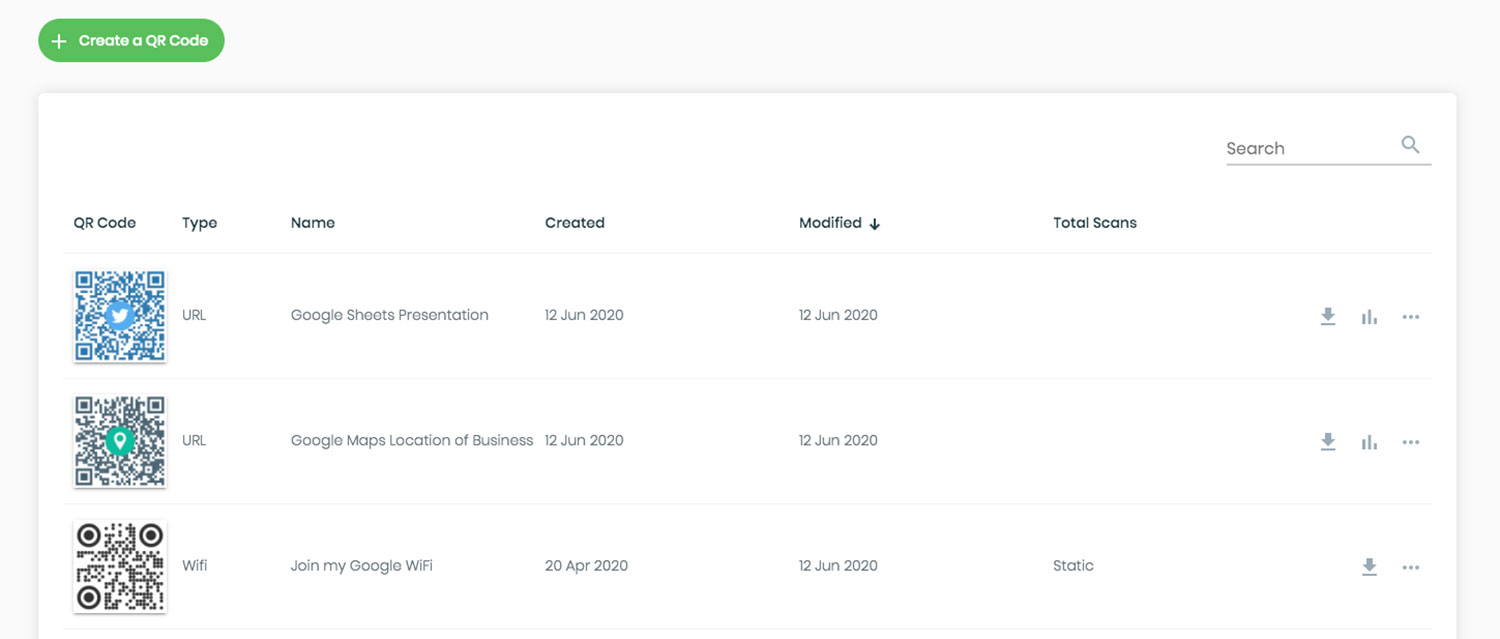
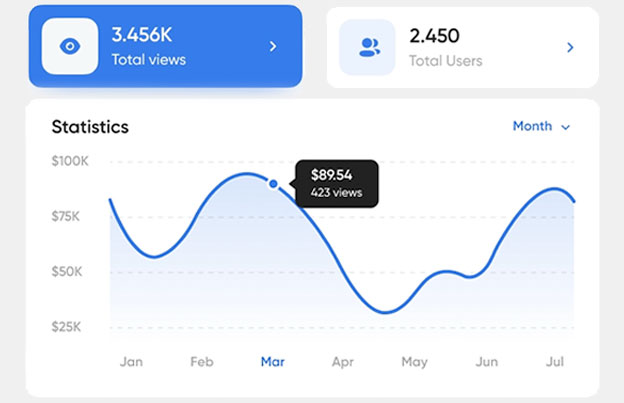
Track Scan Engagement in Real Time Ready to measure how physical campaigns perform across regions and devices? Explore QR code analytics and tracking to review real-time scan metrics from a centralized dashboard.
Healthcare: Delivering Accessible Care and Secure Workflows
In medical environments, scannable codes bridge the gap between complex health documentation and patient accessibility. Deploying QR codes for hospital and healthcare environments helps administrators eliminate manual paperwork and direct patients to authorized resources:
- Expediting patient admissions: Clinics utilize QR-coded SMART Health Links to allow patients to share structured records, medications, and insurance coverage with check-in systems securely.
- Supporting medication compliance: Veterans Affairs pharmacies print codes directly on prescription labels and bottles, linking patients to instructional videos covering dosage and side effects.
- Providing accessible facility navigation: Medical facilities position codes across directional signage so visitors can view mobile floor plans and clinic schedules.
Because patient privacy is paramount, healthcare implementations prioritize data integrity. Codes serve as encrypted pointers to authenticated portals rather than storing sensitive health records directly within the code pattern. Exploring specialized healthcare QR code applications allows providers to balance regulatory compliance with patient convenience.
Manufacturing and Logistics: Tracing Parts and Powering Operations
Industrial operations have moved far beyond basic asset tagging. Facilities use QR kode za proizvodnjo to maintain real-time oversight of assembly lines, component supplies, and equipment lifecycles. By integrating codes directly into tracking materials and products, facilities create digital audit trails for every component.
On factory floors, manufacturers place scannable plates on machinery so technicians can access digital maintenance logs, safety data sheets, and operating manuals instantly. U.S. manufacturers also print codes on specialized parts and shipping containers, allowing defense prime contractors and equipment builders to verify exact machining parameters, raw material batches, and inspection histories. Driven by these operational gains, the industrial QR code label market is projected to reach $3.5 billion by 2033.
Beyond equipment tracking, internal teams apply these workflows to staff development. Many industrial and service enterprises rely on QR codes for employee onboarding to deliver machine-specific safety training videos and operational checklists right at the workstation.
Key Metrics for Evaluating QR Code Performance
Assessing campaign performance requires tracking interaction metrics tailored to your operational objectives. Relying on basic scan counts offers limited perspective; teams need deeper insights into user interaction patterns.
| Metrika | Business Significance | Typical Application |
|---|---|---|
| Scan Volume | Measures overall traffic generated by physical assets | Print marketing and public signage |
| Unique Visitors | Distinguishes individual scanners from repeat users | Loyalty promotions and menu visits |
| Geographic Distribution | Identifies regional engagement hot spots by city or region | Distributed retail packaging and logistics |
| Operating System Breakdown | Informs mobile experience optimization for iOS or Android | App download and digital onboarding links |
| Stopnja konverzije | Measures scanners completing the target post-scan action | Lead capture forms and eCommerce checkouts |
Static vs. Dynamic QR Codes for Business Tracking
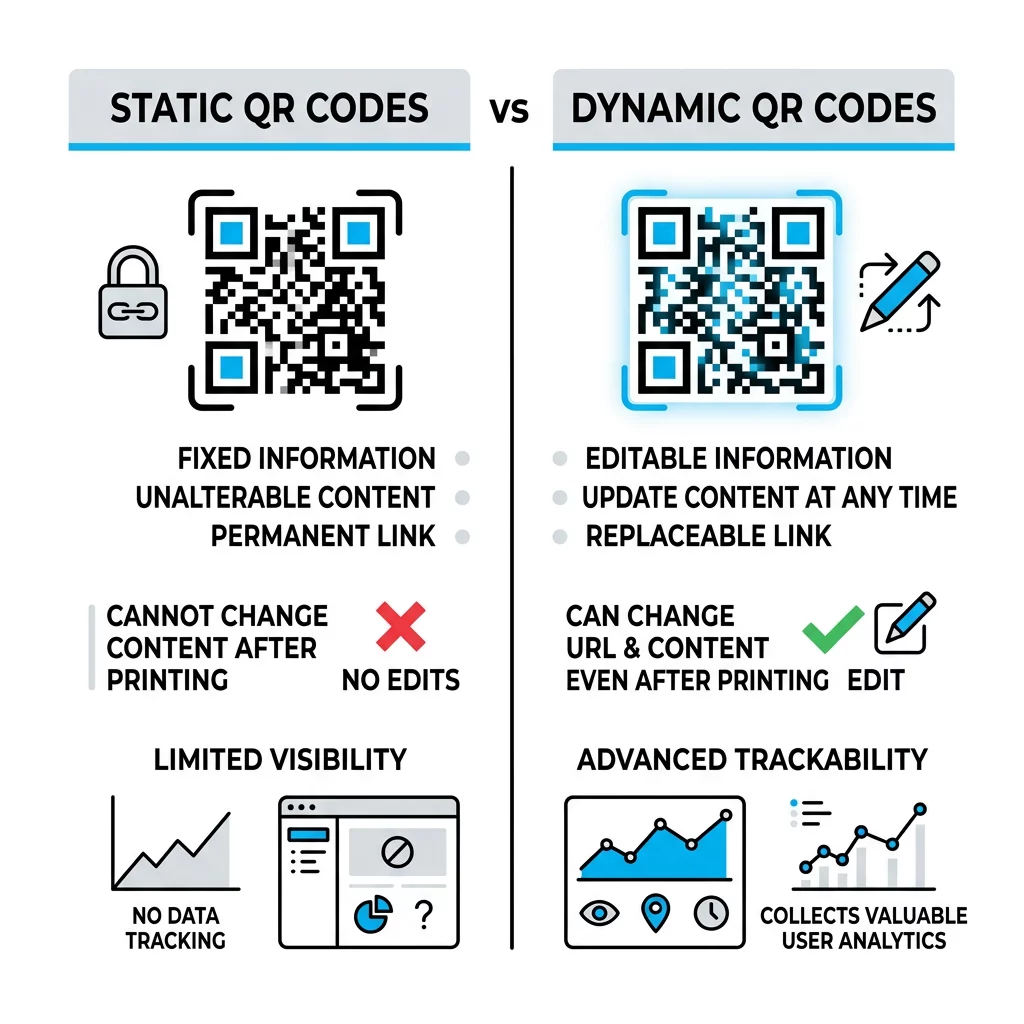
Selecting the appropriate code structure directly determines your measurement capabilities. Static QR codes encode a fixed destination URL directly into the pixel pattern. Once printed, a static code cannot be updated or tracked, making it functional only for permanent, non-critical links like basic contact cards or standard Wi-Fi configurations.
Dynamic QR codes route scanners through a short redirect URL, enabling comprehensive systems for sledenje QR kodam. Dynamic codes log scan times, city-level geographic data, and operating software without gathering unauthorized personal information. Most importantly, administrators can alter the destination URL or swap attached documents at any time without reprinting physical materials, protecting campaign investment across large print runs.
Deploying Safe and Accessible Scanning Experiences
High-performing campaigns pair clear scanning incentives with visual security standards. Following fundamental deployment guidelines ensures that assets remain accessible and trustworthy for every user:
- Maintaining visual contrast: Ensure a minimum 4:1 contrast ratio between dark foreground modules and light background surfaces to support camera sensors and assist individuals with visual impairments.
- Sizing for scanning distance: Print codes at a minimum size of 0.8 by 0.8 inches (2 by 2 centimeters) for hand-held items, expanding dimensions according to a 10:1 viewing distance ratio for posters or signs.
- Providing descriptive context: Include adjacent text instructions explaining the code’s destination, pairing digital displays with text links or screen-reader accessible alternatives.
- Protecting against fraudulent redirection: Guide scanners toward verified domains and configure landing pages with clear branding so users can confirm authenticity before entering information.
Understanding industry adoption patterns allows you to transform static physical surfaces into accountable digital touchpoints. Review Pageloot’s comprehensive industry solutions to configure trackable dynamic codes, optimize print placements, and monitor real-time campaign engagement.
Pogosto zastavljena vprašanja
Dynamic codes track aggregated operational data including scan timestamps, city-level locations, operating systems, and device types. They do not capture personal user identity unless a scanner voluntarily submits information through a connected landing page or form.
The retail sector’s Sunrise 2027 initiative encourages brands to deploy 2D barcodes such as GS1 Digital Link QR codes at point of sale. Traditional 1D UPC barcodes will continue to scan at checkout during and after this transitional period.
Printed QR codes should measure at least 0.8 by 0.8 inches (2 by 2 centimeters) for close-range scanning, maintaining high color contrast between foreground modules and the background. For signs or billboards scanned from farther away, maintain a 10:1 distance-to-size ratio.