Are you unsure whether your QR code design is driving conversions or wasting your print budget? Without systematic testing, offline marketing remains a black box where team assumptions replace verifiable customer data. Running structured A/B tests allows you to compare design and placement variables, identify what motivates scans, and maximize campaign returns.
Why A/B Testing Matters for Offline Campaigns
A/B testing, or split testing, compares two versions of a marketing asset to identify which variation produces better performance. In digital marketing, teams routinely test headlines, button colors, and layouts. Physical marketing touchpoints require the exact same scientific rigor because print runs carry upfront production costs.
Testing offline touchpoints bridges physical collateral with digital analytics. Comparing a control design against an altered variant reveals how real users interact with your materials in their physical environment. Instead of relying on subjective opinions about font choices or frame styles, you collect verifiable behavioral data.
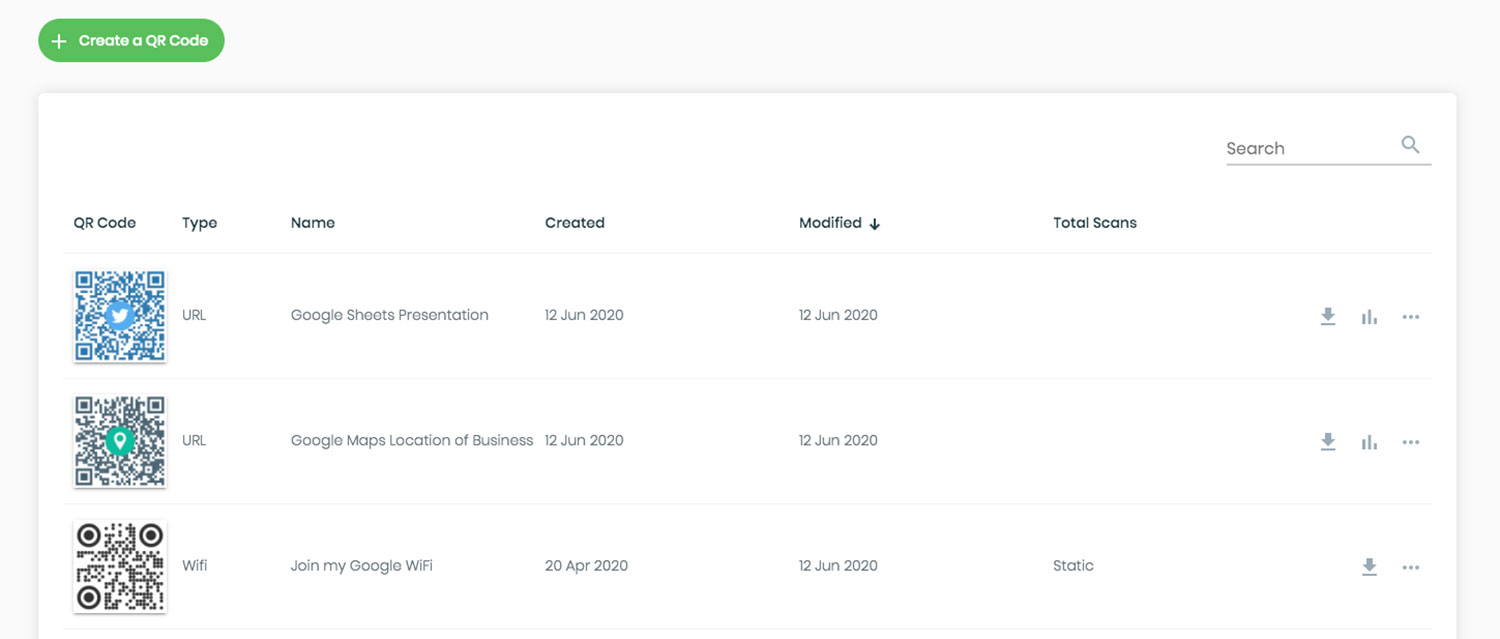
Dynamic QR codes make this experimentation possible. A dynamic code routes users through a short redirect link, allowing you to change destination URLs or tracking parameters without altering the printed artwork. As detailed in our guide on dynamic vs static QR codes in A/B testing, static codes encode a fixed address permanently into their pixel pattern, making continuous measurement and post-print adjustments impossible.
High-Impact Variables to Test in Your Campaigns
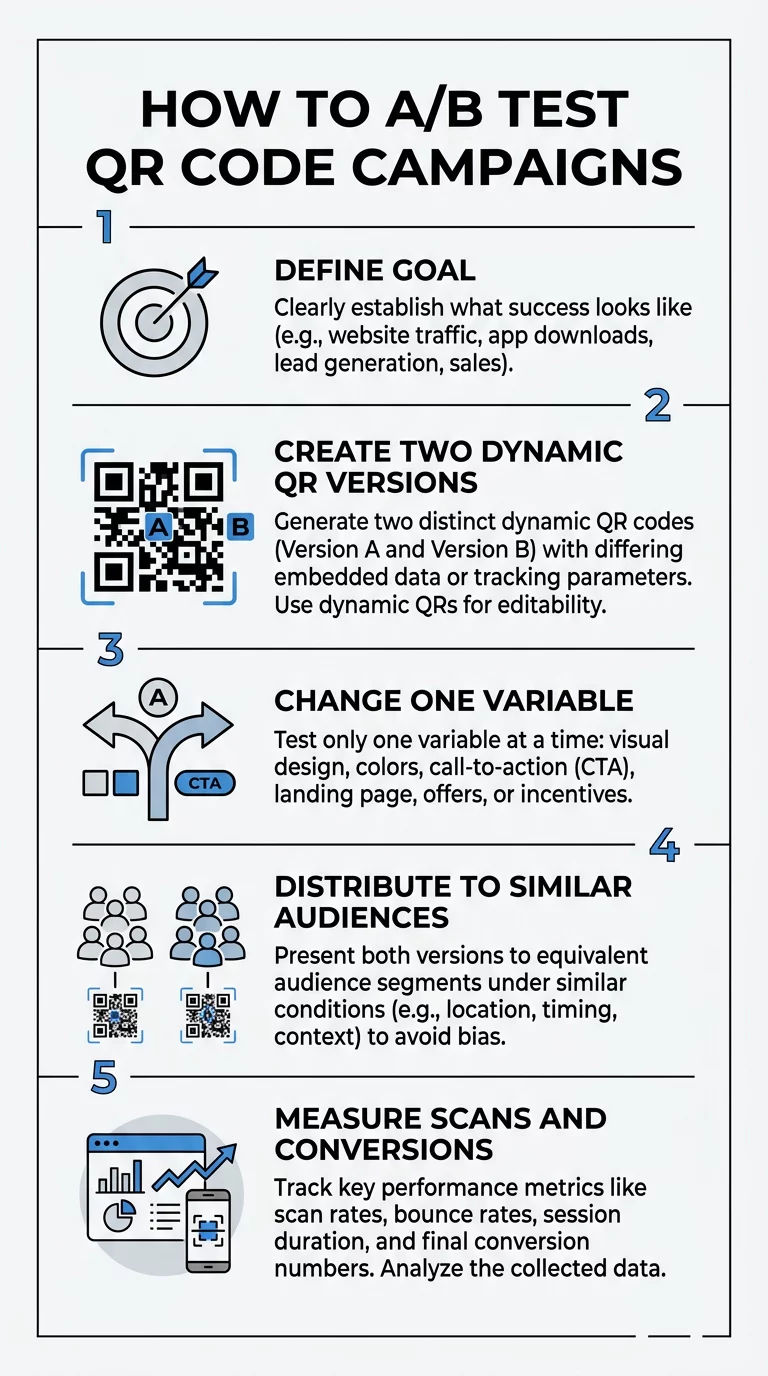
To isolate cause and effect, you must test only one variable at a time. If you alter the call-to-action and the print placement simultaneously, you cannot determine which change drove the difference in scan volume. Focus your experiments on these critical elements:
- Call-to-action text: The prompt framing your code tells users why they should take out their phones. Compare generic labels like “Scan Me” against specific, value-oriented offers like “Scan for 20% Off” or “View the Seasonal Menu.”
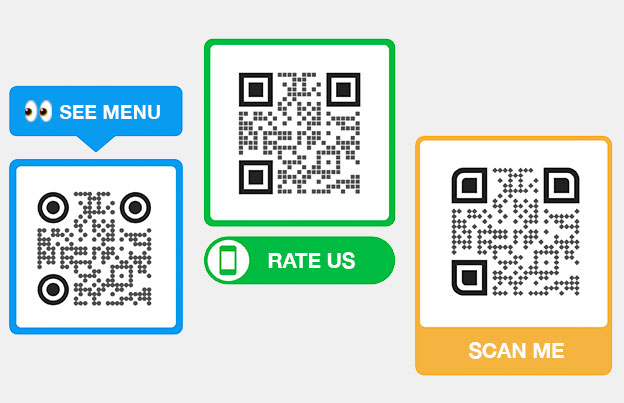
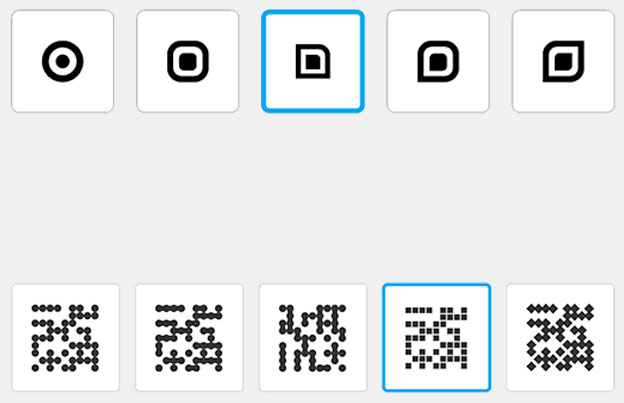
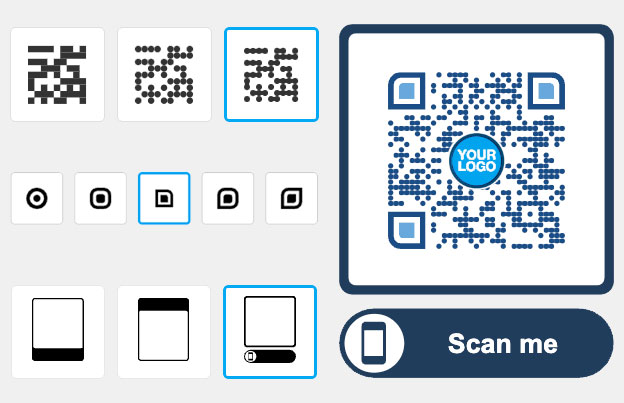
- Visual design and branding: Experiment with adding a brand logo, adjusting frame shapes, or changing accent colors. Always maintain a high-contrast ratio, keeping dark foreground patterns against clean, light backgrounds so camera sensors read the data modules quickly.
- Physical size and placement: Location directly affects foot traffic visibility. Test eye-level posters against checkout counter displays, or evaluate different dimensions using the standard 10:1 distance-to-size ratio, where viewing distance dictates code width. For detailed environmental guidelines, explore our guide to QR code placement in marketing.
- Post-scan landing page experience: A scan represents only the first step in the conversion funnel. Test different mobile landing page variations, such as simplified lead capture forms, alternate product bundles, or faster-loading mobile layouts. Review our strategies for poboljšanje stopa konverzije QR kodova to eliminate post-scan friction.
Deploy Trackable Codes for Your Next Experiment Ready to test your marketing creative in the real world? Use the Generatorom dinamičnih QR kodova to create customizable, editable codes and track scan engagement from a single dashboard.
A Systematic Framework for QR Code Experiments
Reliable testing requires a consistent methodology from initial setup to final statistical evaluation. Follow these operational steps to structure your experiment:
- Establish your hypothesis and primary metric: Define what you are testing and the expected outcome before generating codes. For example, hypothesize that adding an offer-driven CTA increases unique scans by 15 percent over a generic frame.
- Generate unique tracking URLs: Create two separate dynamic QR codes pointing to distinct URLs. Use consistent UTM parameters such as `utmsource`, `utmmedium`, and `utm_campaign` to ensure analytics platforms attribute incoming traffic accurately. Read our walkthrough on tracking offline marketing ROI with QR codes to map parameters cleanly into Google Analytics.
- Validate scannability across devices: Test both printed variants using multiple smartphone camera models, operating systems, and varying ambient lighting levels before distributing production copies.
- Distribute to comparable test groups: Display Version A and Version B in locations with similar customer demographics, lighting conditions, and foot traffic volume during the same promotional window to prevent environmental bias.
- Gather data without early termination: Determine your required sample size in advance using power calculations. Avoid peeking at interim scan counts and stopping tests prematurely, as early significance spikes often produce false positives.
Evaluating Performance Metrics and Post-Scan Conversions
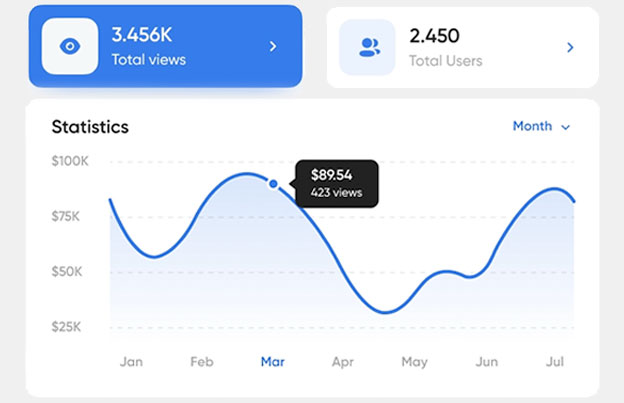
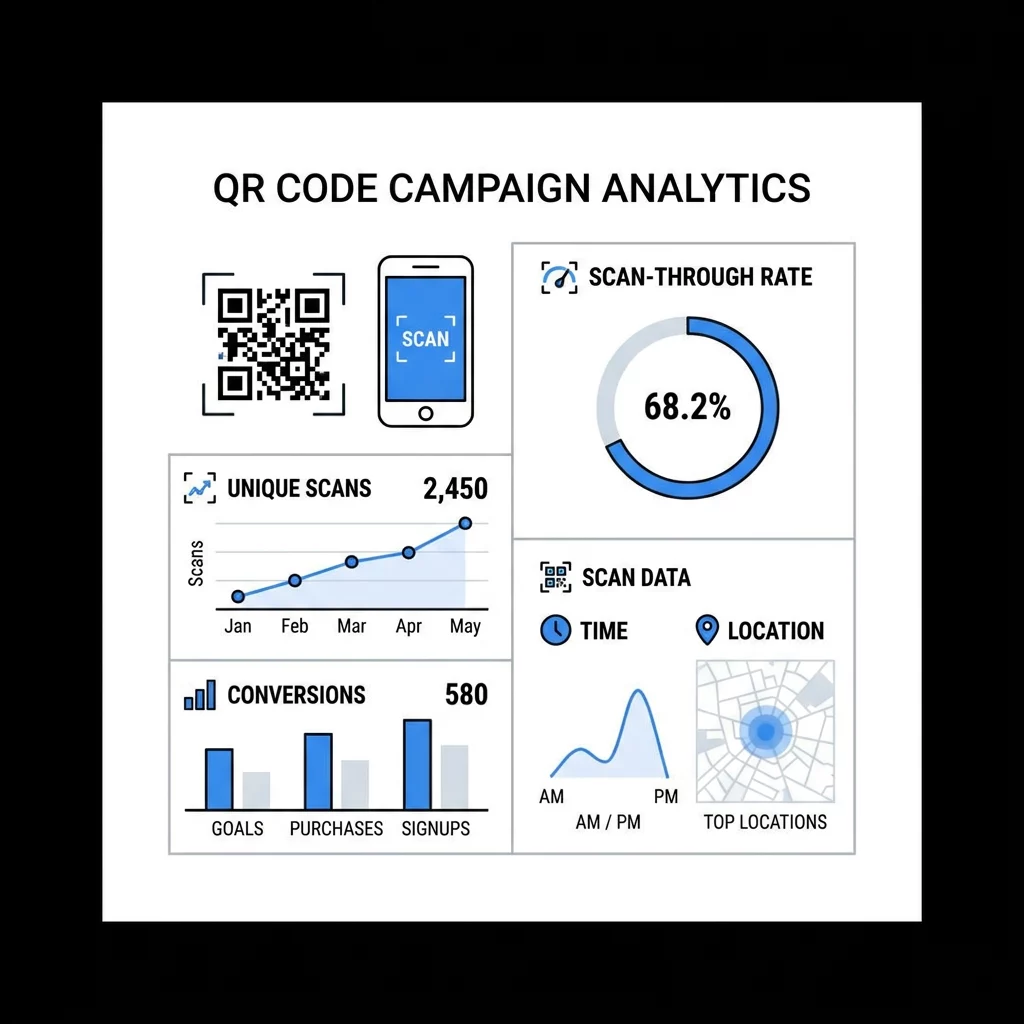
Determining a winning variation requires looking beyond raw scan totals. A high scan count means little if visitors bounce immediately after reaching your landing page. You need to assess both top-of-funnel engagement and downstream conversion events.
| Metrika | Business Focus | Analysis Objective |
|---|---|---|
| Jedinstvena skeniranja | Reach and Audience Interest | Filters out repeat scans from the same user to show actual audience penetration. |
| Ukupna skeniranja | Engagement Volume | Measures overall activity and helps identify repeat interactions or high-frequency usage. |
| Stopa proskeniranja | Placement and CTA Effectiveness | Compares total impressions or foot traffic against actual scans initiated. |
| Stopa konverzije | Downstream Funnel Performance | Tracks the percentage of scanners who complete actions like signups, downloads, or orders. |
| Device and OS Distribution | Technical Optimization | Highlights whether iOS or Android users engage more, guiding technical landing page design. |
| Time and Geographic Data | Scheduling and Regional Context | Identifies peak scanning hours and top-performing physical branches or distribution zones. |
Review your data using dedicated analitiku QR kodova alongside your web measurement suite. If Version A achieves 500 scans with a 2 percent landing page conversion rate (10 sales), but Version B earns 350 scans with an 8 percent conversion rate (28 sales), Version B generates higher business value despite lower top-of-funnel volume.
Common Pitfalls in QR Code Split Testing
Even well-intentioned testing programs can produce flawed conclusions if experimental controls fail. Guard against these common testing mistakes:
- Testing multiple variables at once: Modifying both the call-to-action text and the background color simultaneously invalidates your test, making it impossible to identify which element influenced scanner behavior.
- Relying on insufficient sample sizes: Making strategic decisions after ten or twenty scans risks acting on random statistical noise rather than genuine consumer preference.
- Overlooking external timing bias: Running Version A on a holiday weekend and Version B during an ordinary weekday introduces seasonal bias that distorts results.
- Sending traffic to non-responsive web pages: Mobile users scan QR codes on handheld screens. A desktop-heavy landing page that loads slowly causes scanners to abandon the session immediately.
- Ignoring tracking parameter consistency: Inconsistent capitalization or missing tags across URLs splits data inside reporting tools, corrupting attribution pathways. Learn more about sound data collection in our guide to Praćenje QR koda.
Transforming Scan Insights into Continuous Growth
A/B testing turns offline marketing from an educated guess into a predictable, repeatable growth engine. By isolating individual design elements, establishing strict measurement protocols, and evaluating full-funnel conversion metrics, your business can refine every physical touchpoint over time.
Begin your testing program by reviewing your current print materials, identifying your highest-priority variable, and launching a controlled experiment with dynamic codes. Consistent iteration will help eliminate friction, improve customer response rates, and generate higher returns on every marketing asset you print.
Često postavljana pitanja
Dynamic QR codes route scanners through a redirect link, which enables real-time scan tracking and allows you to modify destination URLs without reprinting your marketing collateral. Static codes encode permanent data and offer no analytics, making them unsuitable for controlled split testing.
An experiment should run until you achieve your pre-calculated sample size and reach statistical significance, which typically takes between two and six weeks. Running tests through full weekly cycles accounts for day-of-week engagement differences and avoids premature conclusions.
The call-to-action text framing the code is typically the highest-leverage initial variable. Clear, benefit-driven messaging informs users why scanning benefits them, providing an immediate lift in scan rates before you begin refining colors or post-scan landing page layouts.